 CryptoChain Blog

Introduction to Bitcoin Cross-Chain Bridges in 2026
Bitcoin remains the dominant cryptocurrency, yet its limited native interoperability creates demand for cross-chain bridges that connect it to ecosystems like Ethereum, Solana, and emerging Layer 2 networks. In 2026, traders increasingly rely on these bridges to unlock liquidity, access DeFi yields, and execute advanced strategies. This analysis explores security risks, liquidity dynamics, wrapped BTC metrics, and practical on-chain monitoring techniques for informed decision-making. As Bitcoin's ecosystem matures, bridges serve as critical infrastructure that enables capital efficiency while introducing new vectors for risk that sophisticated traders must actively manage through continuous observation and diversified approaches.
Core Mechanics of Bitcoin Cross-Chain Bridges
Cross-chain bridges enable BTC to move between networks by locking original Bitcoin and issuing wrapped representations. Common mechanisms include custodial models, where trusted entities hold BTC, and decentralized protocols using smart contracts and multi-signature wallets. Traders benefit from seamless transfers but must understand the underlying trust assumptions that vary widely across solutions. For instance, some bridges rely on federated multisig setups with known signers, while others implement threshold signatures or zero-knowledge proofs to reduce counterparty risk. Understanding these differences helps traders select bridges aligned with their risk tolerance and operational needs in fast-moving 2026 markets.
Security Risks and Mitigation Strategies
Bridge exploits remain a primary concern. In 2026, vulnerabilities often stem from smart contract flaws, oracle manipulations, or centralized custody failures. Traders should prioritize bridges with audited codebases, bug bounty programs, and transparent reserve attestations. Step-by-step risk assessment includes reviewing historical exploit data, evaluating validator decentralization, and monitoring for unusual withdrawal patterns. Additional layers of protection involve using hardware wallets for bridge interactions, maintaining small test transactions before large transfers, and staying informed through official developer channels and community governance forums. Real-world incidents have shown that even well-audited bridges can suffer from novel attack vectors, underscoring the importance of ongoing vigilance rather than relying solely on past security records.
Liquidity Flows and TVL Trends
Bridge total value locked (TVL) reflects market confidence and capital movement. Monitoring inflows and outflows helps identify emerging opportunities and potential stress points. Liquidity fragmentation across multiple bridges can create arbitrage chances, while concentrated flows may signal shifting trader sentiment toward specific networks. In practice, traders examine daily volume reports and compare bridge TVL against overall wrapped BTC supply to gauge relative health. Sudden TVL drops on one bridge often precede wider market movements, offering early signals for position adjustments. Cross-referencing these trends with broader Bitcoin network activity provides deeper context for interpreting whether liquidity shifts represent healthy rotation or emerging concerns.
Wrapped BTC Metrics and Market Indicators
Key metrics include circulating supply of wrapped BTC variants, mint/burn ratios, and premium/discount levels relative to spot BTC. These indicators reveal demand for cross-chain exposure and potential liquidity imbalances. Traders track these through public dashboards and on-chain data providers to time entries and exits effectively. For example, sustained high mint rates on a particular bridge may indicate growing institutional interest in a specific destination chain, while widening discounts can highlight temporary liquidity shortages that create short-term trading opportunities. Combining these metrics with on-chain wallet clustering analysis further refines the picture of who is moving capital and why.
On-Chain Monitoring Techniques: Step-by-Step Workflow
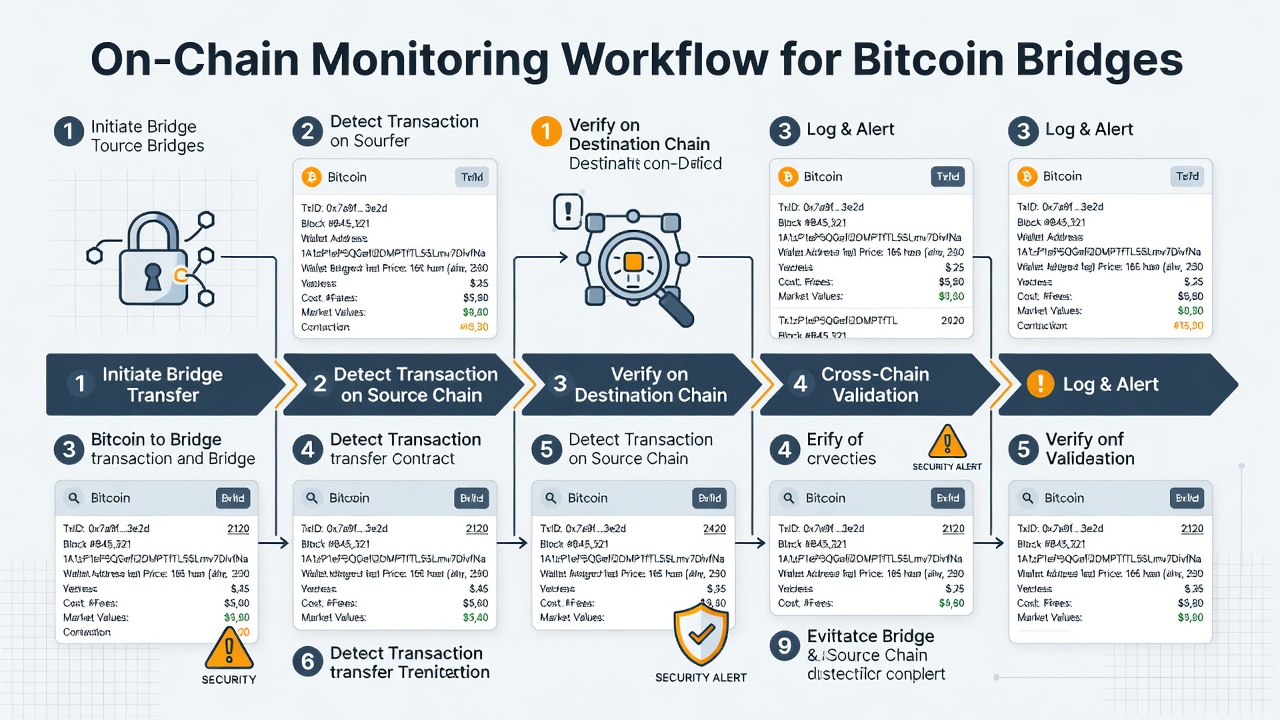
Effective monitoring begins with establishing reliable data sources and repeatable processes. Traders should start by mapping all relevant bridge contract addresses across supported networks. Next, they configure real-time alerts for large lock or unlock transactions that exceed typical thresholds. The workflow continues with regular reviews of mint and burn events to detect anomalies such as mismatched volumes. Additional steps include analyzing validator participation rates, checking for governance proposals that could alter bridge parameters, and cross-validating findings against multiple independent explorers. This structured approach transforms raw blockchain data into actionable intelligence that supports proactive rather than reactive trading decisions.
- Identify target bridge contracts using blockchain explorers.
- Track BTC lock and unlock transactions in real time.
- Monitor wrapped token minting events for anomalies.
- Set alerts for large transfers exceeding historical averages.
- Cross-reference data with network-specific analytics tools.
- Review historical transaction patterns for context on current activity.
- Document observations in a personal trading journal for pattern recognition over time.
Real-World Examples from Major Bridges
Leading solutions demonstrate varying approaches to security and liquidity. Some emphasize multi-party computation for decentralized custody, while others integrate with established oracle networks. Comparing these implementations highlights trade-offs between speed, cost, and trust minimization that traders must weigh. One prominent bridge has focused on expanding to additional Layer 2 networks, resulting in deeper liquidity pools but also increased complexity in monitoring multiple chains simultaneously. Another has prioritized formal verification of its smart contracts, attracting risk-averse institutional participants. Examining these case studies reveals that no single bridge dominates all criteria, so portfolio allocation across several providers often yields the best risk-adjusted outcomes.
Risk Comparison Table
| Bridge Type | Security Model | Liquidity Depth | Exploit History |
|---|---|---|---|
| Custodial | Centralized reserves | High | Moderate |
| Decentralized | Smart contracts + MPC | Medium | Variable |
| Hybrid | Multi-sig + oracles | High | Low-Moderate |
Traders can use this framework to quickly assess new bridge offerings as they launch throughout 2026.
Tracking Bridge Exploits via Blockchain Explorers
Practical tracking starts with labeling known bridge addresses and monitoring transaction volumes. Look for sudden spikes in unlock requests without corresponding locks. Combine explorer data with community reports and official incident disclosures for comprehensive situational awareness. Authoritative resources such as Bitcoin.org provide foundational context on protocol security principles, while Ethereum.org offers guidance on smart contract best practices relevant to many bridge implementations.
Trading Opportunities and Risk Management
Cross-chain bridges open arbitrage, yield farming, and hedging strategies. However, position sizing should account for bridge-specific risks. Diversifying across multiple bridges and maintaining off-chain BTC holdings reduces single-point exposure. Advanced traders also employ conditional orders that automatically exit positions if on-chain metrics breach predefined thresholds. Regular portfolio rebalancing based on updated bridge health scores helps preserve capital during periods of elevated market stress or technical uncertainty.
Frequently Asked Questions
What are the main risks when using Bitcoin bridges in 2026?
Primary risks include smart contract vulnerabilities, custody failures, and liquidity crunches during market stress. Additional considerations involve regulatory changes that could affect bridge operations on certain networks and potential oracle failures that disrupt accurate pricing data.
How can traders monitor bridge health on-chain?
Use blockchain explorers to track lock/unlock events, wrapped token supplies, and validator activity in real time. Supplement these with custom scripts or third-party analytics platforms that aggregate data across multiple bridges for easier comparison.
Which networks currently offer the deepest BTC liquidity via bridges?
Ethereum and select Layer 2 solutions typically host the largest wrapped BTC pools, though trends shift with network upgrades and new bridge deployments on emerging chains.
What practical steps reduce exposure when bridging large amounts?
Break transfers into smaller batches, use time-delayed withdrawals where available, and maintain detailed records of all transactions for post-event analysis if issues arise.
Conclusion
Bitcoin cross-chain bridges continue to evolve in 2026, offering traders expanded opportunities alongside notable risks. By mastering on-chain monitoring, understanding liquidity metrics, and applying structured risk frameworks, participants can navigate this landscape with greater confidence. Continued vigilance and use of resources like Bitcoin.org support ongoing education in this dynamic sector, enabling more resilient trading strategies over the long term.


No comments yet. Be the first!