 CryptoChain Blog

Bitcoin Difficulty Adjustments: 2026 Trader Signals Guide
Bitcoin's difficulty adjustment stands as one of the protocol's most elegant features, automatically recalibrating mining challenges to maintain an average block interval of ten minutes. For traders in 2026, understanding these adjustments provides critical signals on network health, miner economics, and potential price movements. This comprehensive guide explores the underlying mechanics, updated historical patterns at today's massive network scale, and precise workflows for monitoring changes using public data. Readers will learn how to correlate difficulty shifts with hash rate fluctuations and block times, apply real-world examples from recent cycles, and integrate findings into disciplined trading plans.
How Bitcoin Difficulty Adjustment Works
The Bitcoin network performs a difficulty adjustment every 2016 blocks, a period designed to approximate two weeks under ideal conditions. The protocol measures the actual time taken to mine those blocks and compares it against the target of 20160 minutes. When blocks arrive faster than expected due to increased computational power, the difficulty rises proportionally. Conversely, extended block intervals trigger a reduction. The core formula is new_difficulty = old_difficulty × (actual_time / target_time), with strict limits preventing any single adjustment from exceeding a factor of four in either direction. This safeguard protects the network from extreme volatility while allowing gradual adaptation to hash rate changes. In practice, the adjustment occurs at the first block following the 2016-block window, ensuring smooth transitions without interrupting ongoing mining operations.
Traders benefit from recognizing that difficulty changes reflect collective miner behavior rather than external price manipulation. For instance, a sustained hash rate increase from new hardware deployments will eventually force an upward adjustment, tightening margins for marginal operators and potentially influencing short-term selling pressure as less efficient miners exit.
Historical Adjustment Patterns and 2026 Scale
Early Bitcoin adjustments were small because the network operated at modest hash rates. By the 2024 halving cycle, percentage changes frequently reached double digits during bull markets. Updated for 2026 conditions, where total hash rate routinely surpasses 600 EH/s, even modest percentage shifts represent enormous absolute increases in required computational work. Recent cycles demonstrate that difficulty often climbs steadily through expansion phases before experiencing sharp corrections during periods of miner capitulation or energy cost spikes. These patterns repeat with greater amplitude today, yet the protocol's design keeps them predictable in timing if not always in magnitude. Public explorers now display real-time difficulty alongside projected next-adjustment estimates, allowing traders to anticipate shifts days in advance.
Impact on Miner Behavior and Price Action
Difficulty increases directly compress profit margins for miners operating older equipment, prompting decisions about hardware upgrades, relocation to lower-cost energy regions, or temporary shutdowns. In 2026, institutional mining firms dominate much of the hash rate, so adjustments also influence corporate treasury decisions and potential over-the-counter sales. Difficulty drops, by contrast, improve profitability across the board and often precede renewed hash rate growth within days. Historical data from 2025 shows multiple instances where a downward adjustment coincided with reduced selling pressure and subsequent price stabilization. Traders who track these relationships can position ahead of sentiment shifts driven by on-chain fundamentals rather than pure speculation.
Step-by-Step Workflow to Monitor Adjustments
Effective monitoring begins with reliable public sources. Start by checking current difficulty and recent block timestamps on major explorers. Next, calculate the expected adjustment by averaging the last several hundred block times and projecting forward to the 2016-block boundary. Third, overlay hash rate trend lines to confirm whether observed block intervals align with computational power changes. Fourth, configure alerts for blocks approaching the adjustment threshold. Fifth, review mempool statistics for congestion signals that might amplify or dampen the price impact of the upcoming change. Finally, document each adjustment outcome in a trading journal to refine future interpretations. This disciplined process transforms raw protocol data into actionable market intelligence.
Comparisons with Hash Rate and Block Times
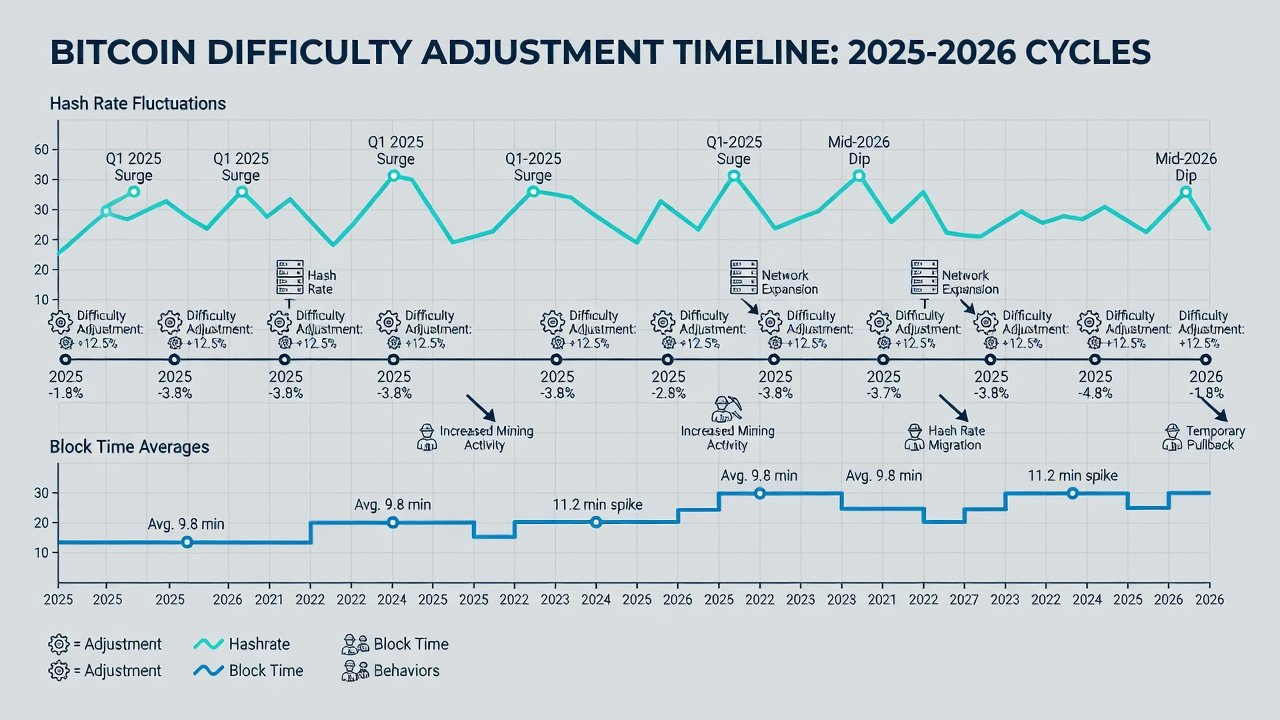
Hash rate quantifies total mining power, difficulty represents the protocol's calibrated response, and block times serve as the immediate observable metric. A sudden hash rate surge shortens average block intervals until the next adjustment restores equilibrium. In 2026 observations, intervals frequently dipped below nine minutes during rapid expansions before correcting upward. Conversely, prolonged intervals above eleven minutes reliably forecast downward adjustments. Using all three metrics together yields higher-confidence signals than relying on any isolated figure. For example, rising hash rate paired with shortening block times and an approaching adjustment date provides strong evidence of an imminent difficulty increase.
- Hash rate spikes typically lead difficulty increases by seven to fourteen days.
- Block time deviations serve as early warning indicators for both upward and downward recalibrations.
- Combined analysis reduces false signals that occur when viewing metrics in isolation.
- Regional electricity price variations further modulate how quickly hash rate recovers after adjustments.
Practical 2025-2026 Cycle Examples
In the March 2025 adjustment cycle, difficulty declined 4.2 percent following a temporary hash rate contraction, after which Bitcoin price recovered approximately twelve percent within ten days. During Q2 2026, an eight percent upward adjustment followed large-scale institutional expansions, resulting in brief consolidation as margins tightened before renewed upward momentum. Another notable case occurred in late 2025 when consecutive small downward adjustments aligned with seasonal energy cost reductions in certain mining regions, supporting a sustained price advance. These examples illustrate the value of cross-referencing difficulty data with broader on-chain and macroeconomic context.
Integrating Signals into Trading Decisions
Traders can incorporate difficulty signals by scaling position sizes ahead of anticipated adjustments and reducing leverage during periods of elevated uncertainty around the 2016-block windows. Risk management improves when entries are timed to coincide with expected difficulty drops rather than fighting upward recalibrations. Backtesting strategies against past cycles reveals that combining difficulty direction with volume confirmation produces more consistent outcomes than directional bets based solely on adjustment magnitude.
Common Mistakes to Avoid
Many traders misinterpret isolated hash rate drops without verifying the adjustment calendar. Others overlook regional energy cost differences that determine post-adjustment miner responses. Additional pitfalls include over-reliance on single data sources and neglecting to maintain detailed records of prior adjustment effects. Consistent verification across multiple explorers and disciplined journaling help mitigate these errors.
FAQ
How often does Bitcoin difficulty adjust?
Every 2016 blocks, roughly every two weeks, based on measured block production times versus the ten-minute target.
Can difficulty adjustments predict price bottoms?
They supply useful supporting signals when analyzed alongside hash rate trends and trading volume, though they function best as one component within a broader strategy.
What public tools help track adjustments?
Blockchain explorers and network statistics platforms provide real-time visibility into difficulty levels, hash rate, and block intervals.
How do 2026 adjustments differ from earlier years?
Higher baseline hash rates produce larger absolute changes, yet percentage limits remain fixed by protocol rules.
For foundational protocol information, consult Bitcoin.org. Comprehensive network statistics appear at Blockchain.com. Additional technical references are available through Bitcoin Wiki.

No comments yet. Be the first!