 CryptoChain Blog
Introduction to Bitcoin Hash Rate Regional Shifts in 2026
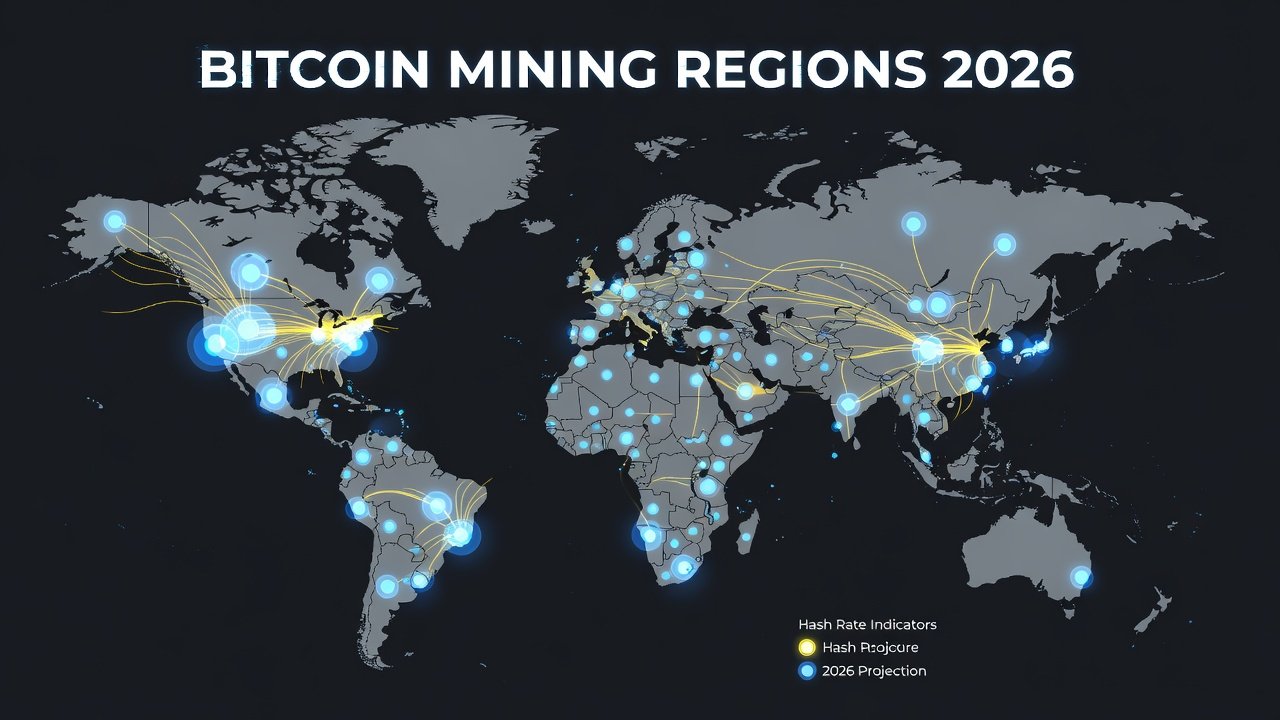
The geographic distribution of Bitcoin mining power has undergone significant transformation by 2026, driven by regulatory changes, energy availability, and technological advancements. Understanding these shifts is essential for traders and analysts seeking to anticipate network resilience and price volatility. This article examines key data sources, regional trends in North America, Asia, and emerging hubs, along with practical analysis methods and trading strategies that can help market participants make informed decisions.
Bitcoin's hash rate represents the total computational power securing the network. When this power migrates between regions, it can signal broader economic or policy developments that often precede price movements. In 2026, diversification across continents has become more pronounced than in previous cycles, reducing single-point vulnerabilities while introducing new variables for volatility forecasting.
Data Sources for Tracking Regional Hashrate
Reliable tracking begins with public blockchain explorers and specialized analytics platforms that aggregate mining pool data and IP geolocation. Key sources include the Cambridge Bitcoin Electricity Consumption Index and reports from major pools such as Foundry and AntPool. These tools provide real-time estimates of hashrate by country or region, allowing users to monitor fluctuations tied to local events like energy price spikes or new legislation.
Traders often combine on-chain data with off-chain signals from government filings and energy market reports. For example, reviewing monthly updates from mining companies listed on public exchanges can reveal planned capacity additions or shutdowns in specific jurisdictions. Cross-verifying multiple sources minimizes estimation errors common in geolocation-based metrics.
Key Shifts in North America
North America has solidified its position as a dominant mining region in 2026 due to favorable energy policies in states like Texas and supportive frameworks in Canada. Miners have relocated operations to leverage renewable sources such as wind and hydroelectric power, contributing to greater network decentralization. These movements enhance overall resilience by reducing concentration risks seen in prior years when Asia dominated the landscape.
Practical examples from 2026 include expansions in Texas facilities that capitalized on grid flexibility programs, allowing miners to curtail operations during peak demand. This adaptability has positioned North American operations as more stable contributors to the global hash rate compared to regions with less flexible energy infrastructure.
Developments in Asia and Emerging Hubs
Asia, particularly regions outside traditional strongholds, continues to adapt amid evolving regulations. Emerging hubs in Latin America and Eastern Europe attract miners with competitive energy costs and pro-innovation policies. These shifts redistribute hashrate, influencing global network security and miner profitability dynamics.
In practice, jurisdictions like Paraguay have seen influxes due to abundant hydroelectric resources, while certain Eastern European countries offer tax advantages that offset higher equipment import costs. Monitoring these emerging areas helps traders identify early signals of hashrate growth that may correlate with local currency stability or infrastructure investments.
Effects on Network Resilience and Bitcoin Price
Regional hashrate concentration can create vulnerabilities during policy shocks, while diversified distribution strengthens the network against attacks. Price movements often correlate with major migrations, as reduced hashrate in one area signals potential supply changes. Traders monitor these patterns to gauge sentiment and forecast volatility over weeks or months.
Historical parallels from earlier cycles show that sudden regional outflows frequently precede periods of heightened price uncertainty. In 2026, the more balanced spread across North America and emerging markets has dampened the severity of such reactions, yet localized events still create tradable opportunities when analyzed correctly.
Step-by-Step Methods to Analyze Correlations
- Collect hashrate data from multiple public sources over a defined period, such as weekly snapshots from the Cambridge index and pool dashboards.
- Identify regional events such as policy announcements or energy crises using news archives and official government releases, noting exact dates for alignment.
- Cross-reference timestamps with Bitcoin price charts from reliable exchanges, focusing on daily or hourly closes around event windows.
- Apply statistical tools to measure correlation coefficients between hashrate changes and price action, including lag analysis to detect delayed effects.
- Validate findings with on-chain metrics like transaction volume and active addresses during the same windows to confirm whether network activity supports observed price trends.
- Document assumptions and repeat the process across multiple events to build a personal reference library of repeatable patterns.
Practical Trading Signals and 2026 Case Studies
Case studies from 2026 policy changes in key jurisdictions demonstrate how sudden hashrate drops preceded short-term price dips, while recoveries aligned with rebounds. Traders use signals such as sustained regional hashrate increases as bullish indicators and abrupt outflows as cautionary flags. Integrating these with broader market analysis improves decision-making accuracy.
One illustrative example involved a major regulatory clarification in a North American state that triggered rapid facility expansions, followed by measurable price stabilization within ten days. Another case in an Asian jurisdiction showed how temporary power restrictions led to a 15 percent regional hashrate decline that coincided with increased intraday volatility, offering short-term trading setups for attentive observers.
Comparisons of Energy Costs and Regulatory Impacts
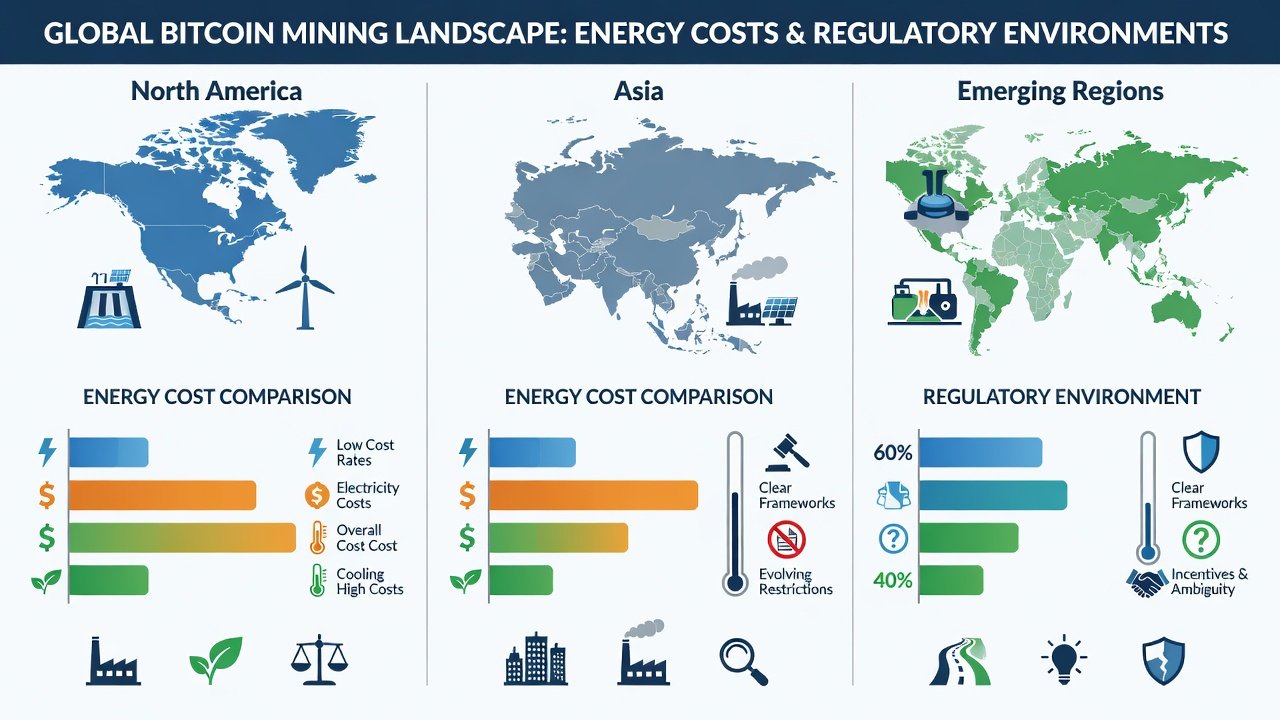
- North American operations benefit from stable, low-cost renewable energy access compared to variable pricing elsewhere, supported by long-term power purchase agreements.
- Asian regulatory environments often impose stricter oversight, elevating compliance expenses and sometimes forcing rapid relocations that disrupt local hashrate contributions.
- Emerging hubs offer tax incentives but face infrastructure challenges that can affect uptime during seasonal demand peaks or grid maintenance periods.
- Traders should compare these factors when evaluating which regions may experience the next wave of mining inflows or outflows.
These factors help traders anticipate where mining activity may shift next, informing volatility forecasts. For authoritative regulatory guidance, consult the U.S. Securities and Exchange Commission. Energy policy insights are available from the U.S. Department of Energy and the International Energy Agency.
Mistakes to Avoid When Analyzing Regional Hashrate Data
Common pitfalls include relying on single-source estimates without cross-verification and ignoring time-zone differences when aligning events with price data. Overlooking seasonal energy variations or assuming all hashrate migrations are permanent can also lead to flawed conclusions. Maintaining a disciplined, multi-source approach helps mitigate these errors.
Conclusion
Bitcoin hash rate regional shifts in 2026 underscore the importance of geographic diversification for network health. By leveraging data-driven analysis and understanding regional dynamics, market participants can better navigate price movements and capitalize on emerging opportunities while maintaining awareness of evolving regulatory and energy landscapes.


No comments yet. Be the first!