 CryptoChain Blog
Introduction to Custom Python Scripts for Bitcoin Analysis in 2026
Intermediate traders navigating 2026 Bitcoin markets encounter unique challenges from heightened institutional flows, evolving regulatory frameworks, and an explosion of on-chain datasets. Generic charting platforms frequently fall short when traders need indicators tuned to specific cycle behaviors or real-time custom signals. This comprehensive guide walks through building robust Python scripts that integrate pandas for data handling, ccxt for seamless exchange connectivity, and direct API integrations with providers like Glassnode and CoinMetrics. You will learn to script core metrics such as realized capitalization and MVRV ratios, rigorously backtest them against multi-year historical cycles, generate professional visualizations using matplotlib, and deploy scalable solutions while sidestepping frequent implementation traps. The emphasis remains on actionable code examples, side-by-side comparisons with commercial alternatives, and decision frameworks that help you decide when to extend scripts versus relying on existing dashboards.
Custom scripting delivers transparency unavailable in black-box tools. By controlling every calculation step, traders can incorporate 2026-specific nuances such as updated ETF flow impacts or post-halving supply dynamics. The following sections provide complete, copy-paste-ready examples that scale from daily batch analysis to near-real-time monitoring.
Setting Up Your Python Environment for Reliable BTC Workflows
Start by creating an isolated virtual environment to avoid dependency conflicts common in multi-project trading setups. Run python -m venv btc_analysis_env followed by source btc_analysis_env/bin/activate on macOS/Linux or btc_analysis_env\Scripts\activate on Windows. Then install the core stack: pip install pandas==2.2 ccxt matplotlib numpy requests python-dotenv. These versions remain stable and widely supported in 2026. Store API credentials in a .env file loaded via dotenv to maintain security best practices. For Glassnode access, register at glassnode.com and generate an API key with appropriate endpoint permissions. CoinMetrics users follow a similar process at coinmetrics.io. Always review the latest rate-limit documentation before launching long-running scripts, as limits can change with usage tiers.
Pulling and Preparing BTC Data via Unified APIs
ccxt abstracts exchange differences, allowing a single code path to fetch data from Binance, Coinbase, or Kraken. Combine this with on-chain endpoints for richer datasets. Below is an expanded data ingestion script that handles pagination, timestamp alignment, and basic cleaning:
import ccxt
import pandas as pd
import requests
from datetime import datetime, timedelta

def fetch_btc_ohlcv(exchange_id='binance', timeframe='1d', limit=500):
    exchange = getattr(ccxt, exchange_id)()
    ohlcv = exchange.fetch_ohlcv('BTC/USDT', timeframe, limit=limit)
    df = pd.DataFrame(ohlcv, columns=['timestamp','open','high','low','close','volume'])
    df['timestamp'] = pd.to_datetime(df['timestamp'], unit='ms')
    return df.set_index('timestamp')

# Example Glassnode realized price call (replace with your key)
def fetch_realized_price(api_key):
    url = 'https://api.glassnode.com/v1/metrics/market/realized_price'
    params = {'a': 'BTC', 'api_key': api_key}
    response = requests.get(url, params=params)
    return pd.DataFrame(response.json())
Merge the resulting DataFrames on timestamp, forward-fill gaps, and resample to consistent daily frequency. This preparation step prevents downstream errors when calculating ratios that rely on precise historical alignment.
Scripting Realized Cap and MVRV Ratios with Production-Grade Functions
Realized cap aggregates the value of all coins at their last on-chain movement price, offering a more stable baseline than simple market cap. MVRV divides market cap by realized cap to flag periods of euphoria or capitulation. Implement modular, testable functions that accept configuration parameters for easy iteration across cycles:
def add_realized_metrics(df, realized_price_series):
    df['realized_price'] = realized_price_series
    df['realized_cap'] = df['realized_price'] * df['circulating_supply']
    df['market_cap'] = df['close'] * df['circulating_supply']
    df['mvrv'] = df['market_cap'] / df['realized_cap']
    df['mvrv_zscore'] = (df['mvrv'] - df['mvrv'].rolling(365).mean()) / df['mvrv'].rolling(365).std()
    return df
These functions integrate directly with the fetched data and allow parameter sweeps, such as adjusting the rolling window for different market regimes. Test each function in isolation using pytest before combining them into larger pipelines.
Backtesting Custom Indicators Against Historical Bitcoin Cycles
Effective backtesting requires careful period selection covering at least two full cycles (2017-2018, 2021-2022) plus the emerging 2025-2026 phase. Split data chronologically to avoid leakage. Implement a simple event-driven backtester that generates signals when MVRV crosses predefined thresholds:
def backtest_mvrv_strategy(df, upper=3.5, lower=0.8):
    df['signal'] = 0
    df.loc[df['mvrv'] > upper, 'signal'] = -1
    df.loc[df['mvrv'] < lower, 'signal'] = 1
    df['returns'] = df['close'].pct_change()
    df['strategy_returns'] = df['signal'].shift(1) * df['returns']
    return df['strategy_returns'].cumsum()
Compare cumulative returns against buy-and-hold and benchmark against metrics such as maximum drawdown and Sharpe ratio. Document every assumption, including slippage estimates and trading fees, to maintain reproducibility. Common pitfalls include survivorship bias in exchange data and ignoring delisting events—always source from multiple venues.
Visualizing Outputs with Matplotlib for Actionable Insights
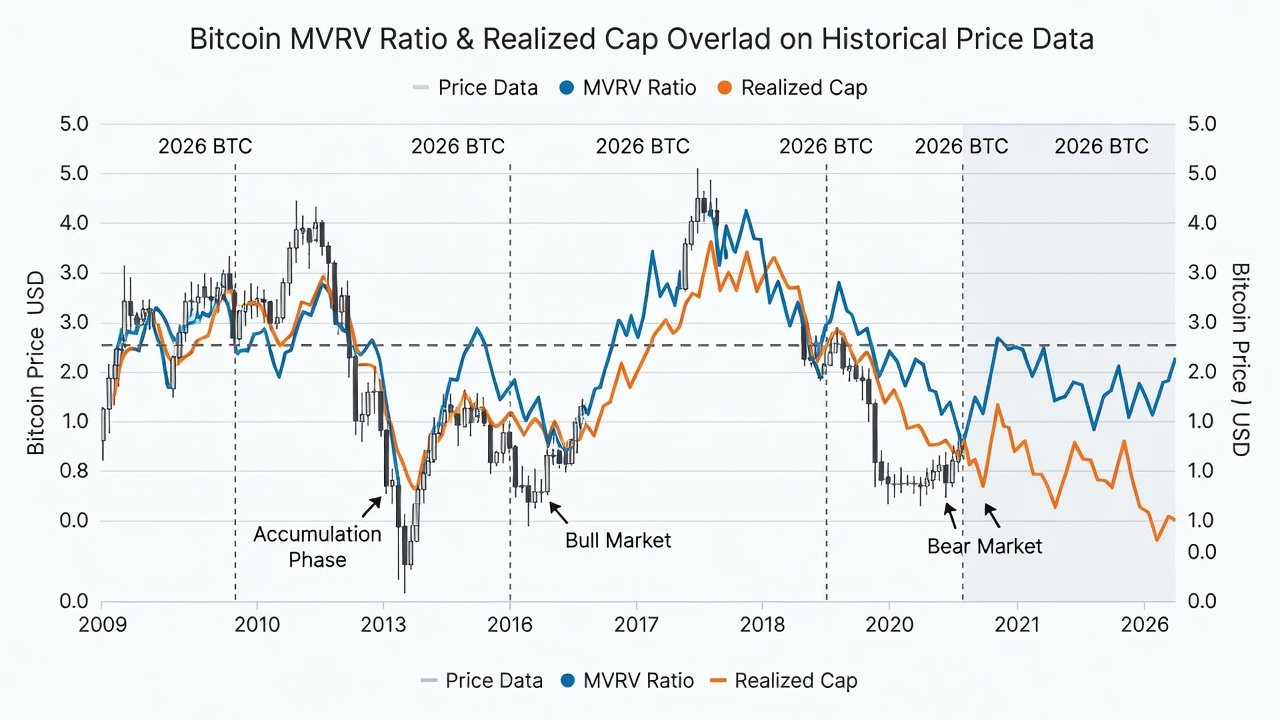
Matplotlib remains the go-to library for publication-quality charts. Create dual-axis plots that overlay price with MVRV and realized cap, adding shaded regions for historically significant zones. Export figures at 300 DPI for inclusion in research reports or automated dashboards. Example code generates interactive-style static images suitable for daily review meetings.
Comparing Custom Scripts to Off-the-Shelf Tools
Platforms such as TradingView or paid on-chain terminals provide polished interfaces and pre-built alerts. However, they limit formula flexibility and impose recurring subscription costs. Custom Python solutions offer full auditability and the ability to combine novel data sources. Most professional traders adopt a hybrid model: use commercial tools for quick scans and custom scripts for deep-dive analysis or proprietary edge development.
Common Pitfalls and How to Avoid Them
- API rate limit violations: Implement exponential backoff with the tenacity library and cache responses using SQLite or parquet files.
- Data accuracy drift: Schedule nightly reconciliation jobs that compare Glassnode and CoinMetrics values on overlapping fields such as active addresses and exchange reserves.
- Scaling to real-time: Refactor monolithic scripts into classes using asyncio for websocket subscriptions; profile memory usage with memory_profiler before deploying on VPS instances.
- Overfitting to recent data: Always validate across multiple regimes and use walk-forward optimization rather than single-period grid searches.
Advanced Extensions for 2026 Market Conditions
Once the core pipeline runs reliably, extend it with sentiment-weighted indicators or ETF flow overlays. Integrate additional endpoints from pandas.pydata.org documentation patterns for time-series resampling. These enhancements keep scripts relevant as new data streams emerge throughout 2026.
FAQs
How do I handle API rate limits when scaling scripts?
Implement retry logic with increasing delays and cache results locally using parquet or Redis. Most providers publish current limits on their developer portals; monitor usage daily.
What steps ensure data accuracy from multiple providers?
Regularly reconcile values between Glassnode and CoinMetrics. Use checksum comparisons on overlapping metrics such as active addresses and implement automated alerts for divergence beyond two standard deviations.
Can these scripts run in real-time for live Bitcoin insights?
Yes, by integrating ccxt websockets and scheduling pandas refreshes every few minutes. Test thoroughly on historical streams first and add circuit breakers for API downtime.
Conclusion
Developing Python scripts for BTC analysis equips traders with powerful, personalized tools suited to 2026 market dynamics. Through careful environment setup, precise metric scripting, rigorous backtesting, and clear visualizations, you can derive actionable intelligence beyond generic platforms. Start with the foundational examples provided, iterate based on your specific strategy requirements, and maintain disciplined version control to preserve research integrity over time.

No comments yet. Be the first!