 CryptoChain Blog

Understanding Bitcoin Difficulty Adjustments in 2026
Bitcoin's difficulty adjustment mechanism remains one of the most reliable indicators for tracking miner behavior and network health. Every 2016 blocks, roughly every two weeks, the protocol recalibrates the mining difficulty to maintain a consistent 10-minute block interval. In 2026, traders increasingly monitor these adjustments alongside real-time miner flow data to anticipate market movements and position themselves ahead of volatility spikes. The adjustment formula accounts for the total hash rate across the network. When hash rate rises, difficulty increases, raising the computational bar for miners. Conversely, drops in hash rate lead to easier targets. This self-regulating system creates clear signals during periods of miner stress or expansion, allowing analysts to interpret shifts in network participation as potential precursors to price action.
Traders in 2026 benefit from understanding that difficulty is not merely a technical parameter but a reflection of economic incentives. For instance, a sudden 8% difficulty increase following a hash rate surge often signals that new, more efficient hardware has entered the ecosystem, which can pressure older operations. Conversely, difficulty reductions provide breathing room for remaining miners, frequently coinciding with accumulation phases observable on-chain.
Hash Rate Responses and Miner Profitability Thresholds
Miners respond dynamically to difficulty changes based on their operational costs. High electricity expenses force less efficient operations to shut down when rewards fall below break-even levels. In volatile markets, hash rate can fluctuate sharply as participants exit or enter the network, creating observable patterns that experienced traders exploit. Profitability thresholds depend on factors like hardware efficiency and energy prices. Miners track metrics such as revenue per terahash to decide whether to continue operations. When difficulty spikes without corresponding price support, marginal miners often capitulate, leading to temporary hash rate declines that ripple through the network.
Real-world examples from early 2026 illustrate this: after a difficulty hike in March, several smaller pools reduced output by 15%, visible through public pool statistics. This response highlights how profitability thresholds act as a natural filter, ensuring only the most competitive miners survive each cycle. Understanding these thresholds helps traders differentiate between routine fluctuations and genuine stress signals that may precede broader market corrections.
Key On-Chain Data Sources for Miner Flow Tracking
Accessing reliable data is essential for analysis. Platforms like Bitcoin.org provide foundational protocol details, while explorers such as mempool.space offer live hash rate and difficulty charts. Additional sources include blockchain analytics tools that aggregate miner wallet activity and pool distributions, enabling granular tracking of flows between mining addresses and exchanges.
Traders combine these with exchange inflow data to gauge selling pressure. Large transfers from mining pools to exchanges often precede capitulation events, offering early warnings. In 2026, integrating multiple data layers—such as hash rate velocity, pool hashrate shares, and address clustering—provides a more complete picture than relying on any single metric alone.
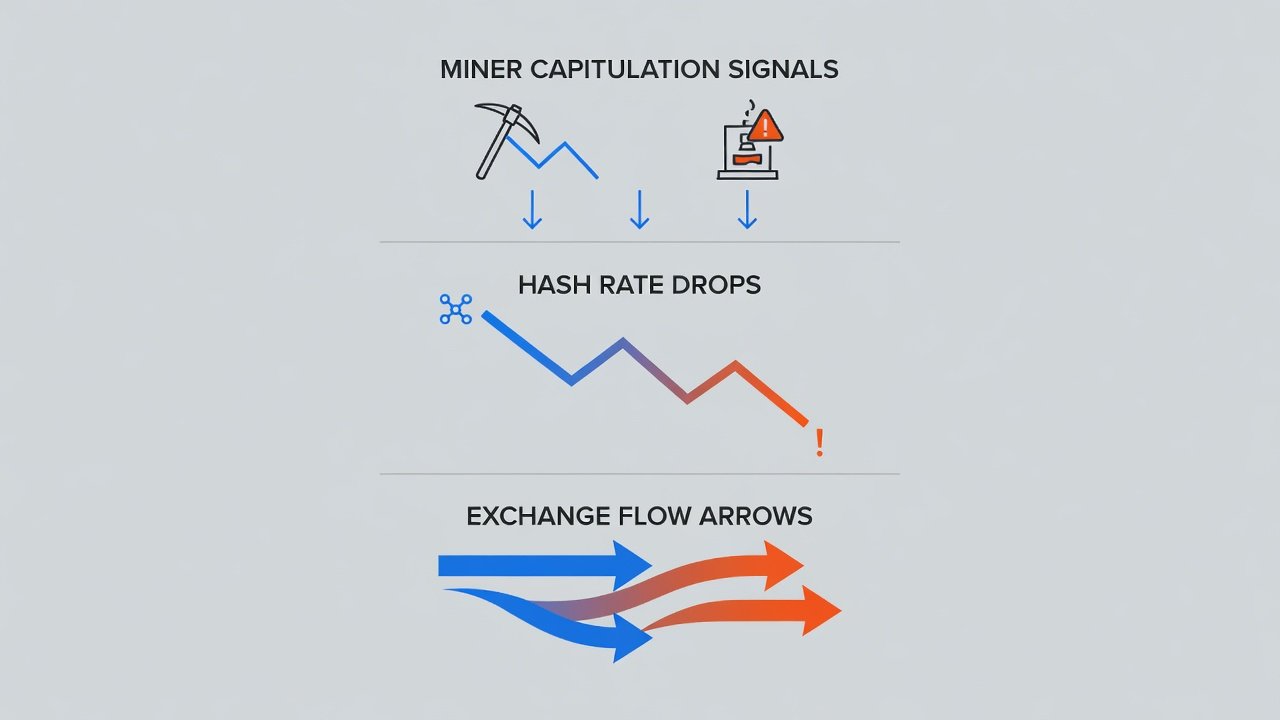
Step-by-Step Guide to Spotting Capitulation Signals
- Monitor difficulty adjustment announcements for unexpected increases exceeding 5% and note the accompanying hash rate context.
- Track hash rate drops over consecutive days using real-time dashboards, paying special attention to multi-day trends rather than intraday noise.
- Analyze miner wallet outflows to exchanges for clusters of activity exceeding historical averages, cross-checking against known mining pool addresses.
- Cross-reference with price action to confirm if selling coincides with difficulty shifts, looking for divergences where price holds steady despite miner exits.
- Look for recovery patterns as surviving miners stabilize the network, often marked by a subsequent difficulty decrease that signals renewed equilibrium.
- Incorporate volume data from major exchanges to validate whether outflows translate into actual sell pressure or simply represent operational rebalancing.
Comparisons to Historical Bitcoin Cycles
Past cycles, such as the 2022 bear market, showed similar patterns where difficulty remained elevated even as hash rate fell 30-40%. Recovery followed price rebounds that restored profitability for efficient operators. In contrast, the 2024 halving cycle demonstrated faster adjustments due to improved mining efficiency and geographic diversification of hash power. 2026 traders apply these lessons by focusing on relative changes rather than absolute values, recognizing that each cycle introduces new variables like regulatory shifts and hardware advancements.
For example, the 2018 cycle featured prolonged difficulty plateaus during capitulation, while 2022 saw sharper rebounds once price stabilized above key thresholds. By studying these historical parallels, analysts can better calibrate expectations for how quickly hash rate may recover in the current environment, improving the timing of entry and exit decisions.
Integrating Miner Flows with Exchange Data
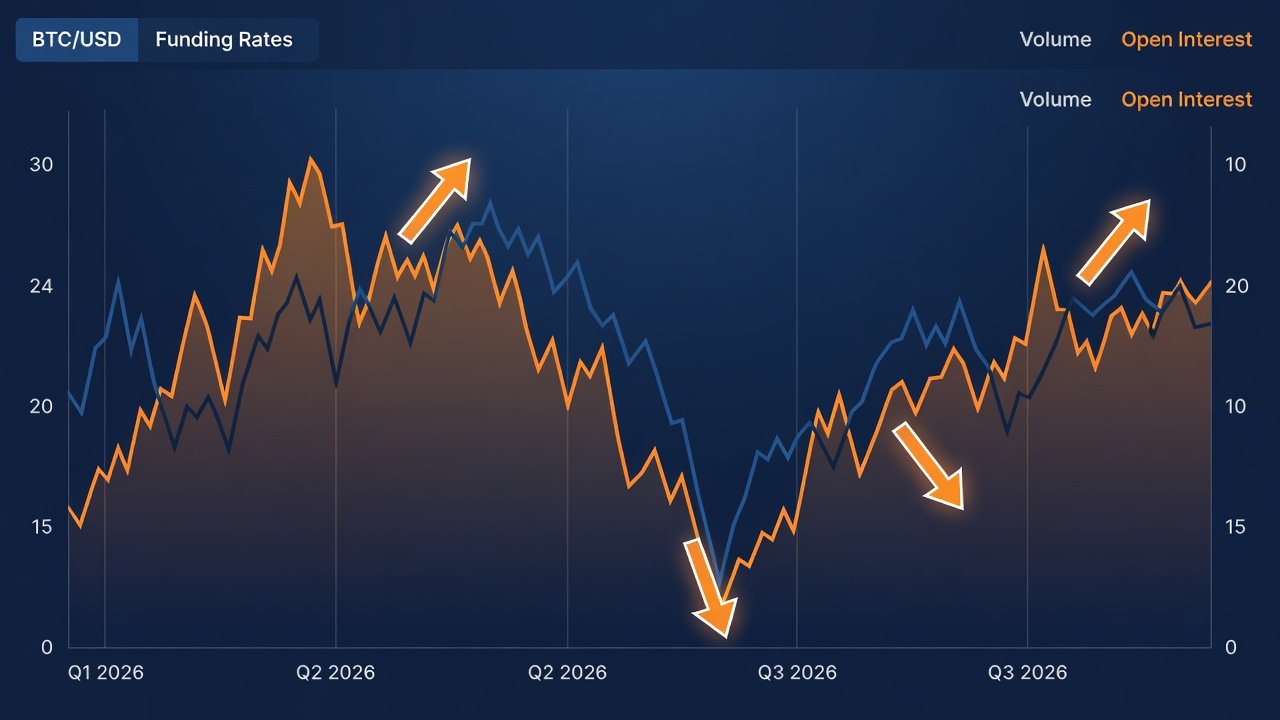
Combining on-chain miner metrics with exchange flows enhances signal accuracy. Sudden spikes in miner-to-exchange transfers during difficulty upticks often indicate forced selling. Conversely, stable or declining exchange inflows during hash rate recoveries suggest accumulation phases by stronger hands. This integrated approach helps distinguish between temporary volatility and structural shifts in miner sentiment, providing traders with actionable context for position management.
Practical applications include setting alerts for correlated movements, such as a 10% hash rate drop paired with elevated exchange deposits from identified mining entities. Over time, these correlations have proven more reliable than isolated metrics, reducing the likelihood of reacting to noise in fast-moving markets.
Practical Checklist for Avoiding False Positives
- Verify data across multiple sources before acting on signals to eliminate single-point errors.
- Ignore isolated hash rate dips lasting less than 48 hours, as these frequently represent maintenance or temporary power issues.
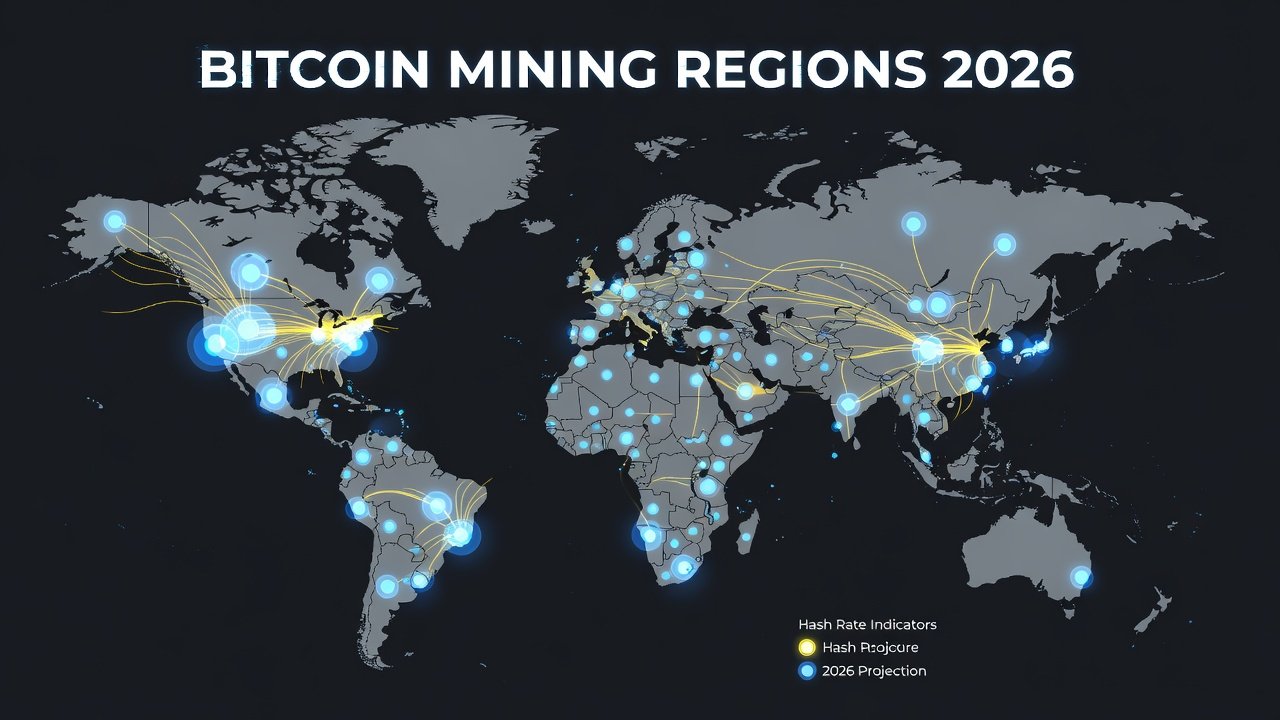
- Account for seasonal factors like regional energy regulations or weather-related disruptions in key mining regions.
- Wait for confirmation from at least two adjustment cycles before interpreting a trend as structural.
- Use volume-weighted metrics to filter noise in volatile conditions and prioritize sustained movements over one-off events.
- Cross-check against macroeconomic indicators, such as energy price trends, to contextualize miner behavior beyond network data alone.
Frequently Asked Questions
How often do difficulty adjustments occur?
Adjustments happen automatically every 2016 blocks, averaging two weeks but varying with network speed depending on hash rate fluctuations.
What indicates a true miner capitulation event?
Coordinated hash rate decline, rising exchange inflows from known mining addresses, and sustained difficulty elevation typically confirm capitulation beyond routine operational changes.
Can these signals be used for short-term trading?
While useful for context, miner flow signals perform best when combined with broader market analysis rather than standalone short-term trades, as false positives remain common in high-volatility periods.
How do regulatory changes impact miner flows in 2026?
Regional policy shifts can accelerate or delay capitulation by altering energy costs, prompting miners to relocate hash power and creating observable on-chain migration patterns.
Conclusion
Mastering Bitcoin difficulty signals and miner flows equips 2026 traders with a robust framework for navigating network dynamics. By focusing on mechanics, data sources, and integrated analysis, participants can identify high-probability opportunities while minimizing risks from false signals in an ever-evolving market landscape.
No comments yet. Be the first!