 CryptoChain Blog
Understanding Bitcoin Funding Rates in Perpetual Futures
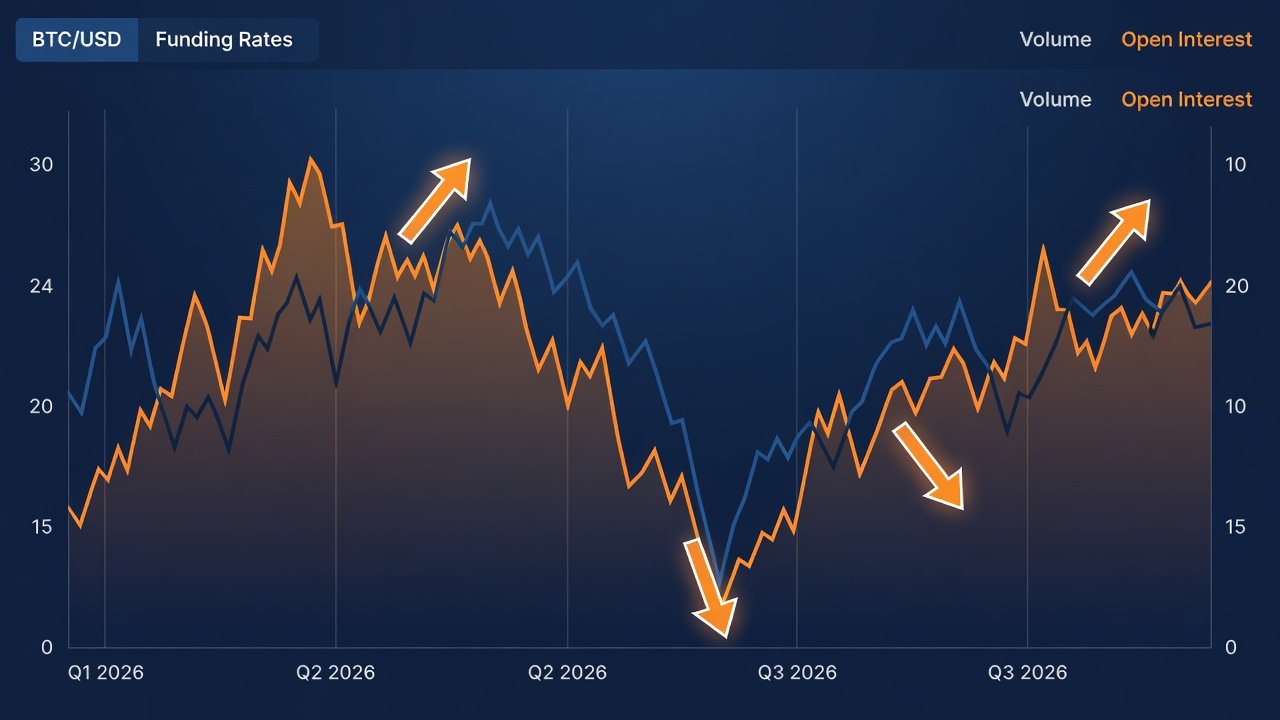
Bitcoin perpetual futures contracts dominate crypto derivatives trading, and their funding rates serve as a real-time gauge of market sentiment. These rates are periodic payments exchanged between long and short traders to keep the contract price aligned with the spot market. When funding rates turn positive, longs pay shorts, signaling bullish dominance. Negative rates reverse the flow, highlighting bearish pressure. In 2026, divergences between funding rates and Bitcoin’s price action have emerged as powerful reversal indicators. Traders who monitor these mismatches can anticipate sentiment shifts before they appear in spot prices. This dynamic becomes especially relevant during periods of heightened volatility driven by macroeconomic events, regulatory updates, and institutional inflows that characterize the current cycle.
Mechanics of Funding Rate Divergences
A divergence occurs when Bitcoin’s price moves in one direction while funding rates move opposite. For example, rising prices paired with declining or negative funding rates suggest weakening bullish conviction. Conversely, falling prices with increasingly positive rates may indicate capitulation is nearing an end. Consider a scenario where Bitcoin climbs steadily over several days on spot markets, yet funding rates on major platforms begin to drop from positive territory into neutral or negative zones. This mismatch often reflects leveraged longs reducing exposure or new shorts entering at higher levels, foreshadowing a potential pullback. Popular exchanges such as Binance and Kraken publish real-time funding data. Intermediate traders combine this with order book depth and open interest to confirm signals. During the 2024–2025 cycle, similar divergences preceded major local tops and bottoms by 3–7 days on average. In 2026, the same mechanics apply but unfold faster due to improved liquidity and algorithmic trading participation.
Historical Patterns from Prior Cycles
Looking back to 2021 and 2024 bull runs, extreme positive funding rates often coincided with local tops, followed by sharp corrections. Negative rates frequently marked capitulation zones that preceded strong rebounds. In 2026, analysts note similar behavior emerging around key resistance levels near previous cycle highs. These patterns repeat because funding rates reflect leveraged positioning. When too many traders crowd one side, reversals become more likely as liquidations cascade. For instance, the 2021 bull market saw multiple instances where funding rate peaks preceded corrections of 20% or more within a week. The 2024 halving cycle mirrored this with negative funding clusters at major support levels that triggered rapid recoveries. Early 2026 data shows comparable setups forming around psychological price barriers, reinforcing the predictive value of these divergences across market regimes.
Step-by-Step Monitoring Techniques
- Track funding rates across multiple exchanges every four hours using their public APIs or dashboards.
- Compare 8-hour and 24-hour averages to filter noise from short-term spikes.
- Overlay rates with Bitcoin spot price on charting platforms for visual divergence detection.
- Set alerts for divergences exceeding typical thresholds from the 7-day mean.
- Cross-reference with exchange-specific open interest changes and volume profiles.
- Review weekly aggregated data from platforms like Bybit to validate trends across venues.
Consistent monitoring helps traders avoid false signals during low-volatility periods. Advanced users can automate alerts via custom scripts that pull data from exchange endpoints and plot divergence scores in real time.
Positive vs Negative Rate Impacts on Positioning
Positive funding rates encourage long bias but increase liquidation risk if prices stall. Traders often reduce leverage or hedge with options when rates spike. Negative rates push shorts to cover, creating short squeezes that fuel rapid upside moves. In 2026’s volatile environment, understanding these dynamics allows better entry timing and position sizing. A positive divergence during an uptrend might prompt traders to tighten stops or scale out partially, while negative rates in a downtrend could signal opportunities to add to long positions with defined risk. Comparing the two extremes shows that positive rates tend to precede more gradual corrections, whereas negative rates often lead to sharper, volatility-driven rebounds.
Risk Management Strategies for 2026 Volatility
Position sizing should account for funding costs over multi-day holds. Use stop-losses placed beyond recent swing highs or lows rather than arbitrary percentages. Diversify across spot, futures, and options to mitigate funding-driven volatility. Review positions daily when divergences widen, and maintain cash reserves for opportunistic entries after liquidations. Additional tactics include scaling into positions gradually as divergences confirm and employing trailing stops that adjust based on funding rate normalization. Traders should also factor in correlation with broader equity markets and Bitcoin dominance metrics to avoid isolated signals that fail during systemic events.
Integrating On-Chain Metrics for Stronger Confirmation
Funding rate signals gain reliability when paired with on-chain data. Exchange reserves, active addresses, and realized price metrics from sources like Bitcoin.org provide fundamental context. Rising exchange inflows during negative funding often confirm distribution, while declining reserves alongside positive divergences support accumulation narratives. Additional metrics such as realized cap, MVRV ratios, and long-term holder supply changes can further validate whether a funding divergence aligns with underlying network health. For example, a negative funding divergence paired with decreasing exchange reserves and rising active addresses has historically marked strong reversal points with higher conviction.

Common Pitfalls to Avoid
- Ignoring exchange-specific rate differences that can distort aggregated views and lead to inaccurate divergence readings.
- Trading divergences without volume confirmation, which often results in whipsaw trades during choppy markets.
- Over-leveraging during extreme rate spikes, amplifying losses when reversals extend beyond expected timelines.
- Neglecting macroeconomic events that override technical signals, such as regulatory announcements or macroeconomic data releases.
- Failing to backtest strategies across multiple cycles, leaving traders unprepared for regime shifts in 2026 volatility.
Practical Checklist for 2026 Traders
- Daily review of funding rates on at least three major exchanges.
- Weekly comparison with on-chain exchange flows and active address trends.
- Monthly backtesting of divergence signals against historical outcomes.
- Quarterly adjustment of risk parameters based on volatility regimes.
- Integration of at least two on-chain metrics before executing trades on confirmed divergences.
- Documentation of each signal with entry, exit, and funding cost notes for continuous improvement.
FAQ
How quickly do funding rate divergences resolve in 2026?
Most divergences correct within 3–10 days, though strong trends can extend this window depending on broader market participation.
Which exchanges provide the most reliable funding data?
Binance, Bybit, and OKX offer transparent, high-volume data suitable for analysis, with Kraken providing strong regulatory transparency.
Can funding rates be used alone for trading decisions?
No—always combine with price action, volume, and on-chain metrics for higher-probability setups and to filter noise.
What tools are best for tracking funding rate divergences?
Exchange APIs combined with charting platforms like TradingView allow custom overlays, while aggregator sites simplify multi-exchange monitoring.
How do 2026 volatility factors change divergence reliability?
Increased institutional flows and algorithmic trading can accelerate resolution times, requiring faster monitoring and adaptive risk rules.
Conclusion
Bitcoin funding rate divergences offer intermediate traders a valuable edge for navigating 2026 market reversals when used with disciplined monitoring, on-chain confirmation, and robust risk management. By studying historical patterns, applying step-by-step techniques, and avoiding common pitfalls, traders can position themselves more effectively amid ongoing volatility.

No comments yet. Be the first!