 CryptoChain Blog
Introduction to Bitcoin Fee Market Dynamics in 2026
The Bitcoin fee market has become a critical lens for traders seeking precise entry and exit signals. In 2026, on-chain metrics reveal evolving patterns of congestion and competition that directly influence price action. Understanding these dynamics allows intermediate and advanced analysts to move beyond simple price charts and incorporate real-time fee data into their decision frameworks. Fee markets reflect supply and demand for block space. When demand surges, fees rise and mempools fill, often preceding or coinciding with volatility spikes. This guide examines congestion patterns, estimation tools, historical halving effects, and practical monitoring techniques using free dashboards. Traders who master these elements gain an edge in timing positions during both high-congestion events and periods of network calm. The 2026 landscape shows increased sophistication in fee estimation algorithms driven by layer-two adoption and institutional flows, making fee analysis more nuanced than in previous cycles.
Mempool Congestion Patterns and Their Trading Implications
Mempool congestion occurs when unconfirmed transactions exceed available block capacity. In 2026, analysts observe distinct patterns tied to market cycles. During periods of high retail activity, low-fee transactions linger while high-fee ones clear quickly, creating visible fee-rate distributions. Traders monitor the percentage of transactions paying above-median fees as an early congestion indicator. Sustained elevation often signals building momentum that can translate into price volatility within hours or days. Conversely, clearing mempools with compressed fee ranges frequently precede consolidation phases. Advanced observers also track replace-by-fee (RBF) rates and child-pays-for-parent (CPFP) usage, which reveal miner incentives and transaction prioritization strategies. These patterns help differentiate between organic demand spikes and coordinated network stress events.
Key Congestion Metrics to Track
- Transaction count versus block capacity ratio
- Fee rate percentiles across the mempool
- Time-to-confirmation for median-fee transactions
- Orphaned or replaced-by-fee events
- Distribution of RBF-enabled versus non-RBF transactions
- Impact of Lightning Network channel openings on base-layer demand
By combining these metrics, traders build composite congestion scores that correlate strongly with subsequent price movements. For example, a sudden rise in high-percentile fees combined with increased RBF activity has preceded several notable 2026 volatility events.
Fee Estimation Tools for Real-Time Insights
Accurate fee estimation helps traders time broadcasts to minimize costs while ensuring inclusion. Leading free platforms provide multi-hour forecasts based on current mempool state and historical confirmation data. Step-by-step example using public dashboards: First, access a real-time mempool visualizer. Next, review the fee distribution histogram to identify the minimum rate needed for next-block confirmation. Then, compare that rate against historical averages during similar network load. Finally, set alerts for when rates drop below your threshold before executing trades. These tools integrate seamlessly with trading workflows. Analysts who cross-reference fee estimates with order-book depth gain an edge in anticipating liquidity shifts. In practice, one effective approach involves monitoring three different estimators simultaneously to identify consensus ranges, reducing the risk of outlier predictions during unusual network conditions. This multi-estimator method has proven especially valuable during weekend low-liquidity periods when fee markets can behave erratically.
For authoritative reference, consult mempool.space and bitcoin.org resources on transaction processing.
Historical Fee Spikes During Halvings and Volatility Correlations
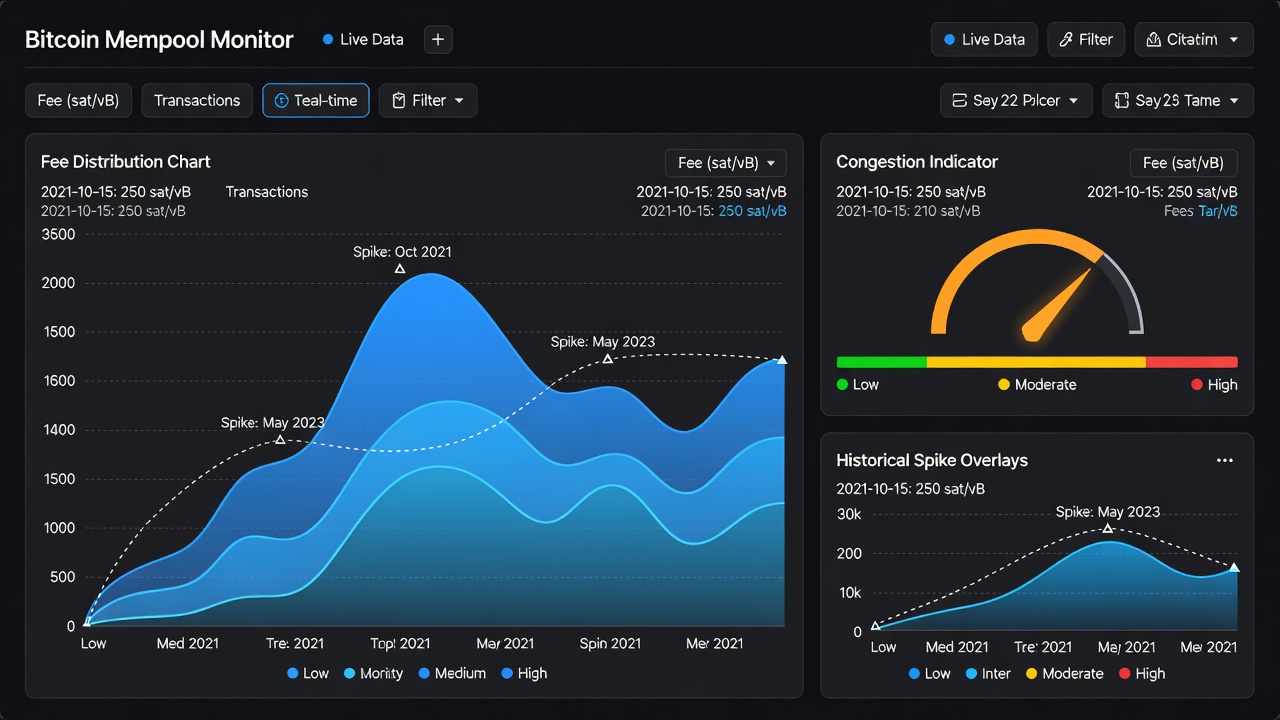
Halving events historically trigger pronounced fee market reactions. The reduction in block subsidies intensifies competition for transaction fees, often resulting in sharp, temporary spikes. These spikes frequently correlate with increased price volatility as miners adjust revenue expectations and traders reposition. Comparative analysis across cycles shows bull-phase halvings produce more sustained fee elevation due to higher overall demand. Bear-phase halvings tend to generate shorter spikes followed by rapid normalization. Traders use these historical parallels to model expected post-halving behavior in 2026. The 2024 halving, for instance, demonstrated a three-day fee surge that aligned with a 12 percent price swing, offering a template for current cycle modeling. Analysts also examine the ratio of fee revenue to subsidy revenue post-halving, which serves as a leading indicator of miner profitability shifts and potential hash-rate migrations.
Bull vs Bear Phase Fee Behavior Comparison
| Phase | Average Fee Elevation Duration | Volatility Correlation | Typical Trader Response |
|---|---|---|---|
| Bull Market | 3–7 days post-halving | Strong positive | Accumulate on fee compression |
| Bear Market | 1–3 days post-halving | Moderate, short-lived | Wait for mempool normalization |
Practical Monitoring: Step-by-Step Dashboard Workflow
Follow this repeatable process to integrate fee trends into daily analysis: Open a free mempool dashboard and enable real-time updates. Record baseline fee percentiles at market open. Set threshold alerts for 50 percent and 90 percent fee-rate increases. Cross-reference spikes with exchange funding rates and spot volume. Log outcomes in a trading journal to refine future signals. This workflow transforms raw fee data into actionable trading signals while remaining entirely free. Seasoned traders often layer additional filters, such as monitoring the ratio of high-fee to low-fee transactions over rolling 24-hour windows, to filter noise. Incorporating these steps into automated scripts or spreadsheet models further enhances consistency and reduces emotional decision-making during fast-moving markets.
Advanced Techniques and Common Pitfalls
Beyond basic monitoring, advanced users examine fee market elasticity by comparing fee changes against on-chain volume growth. They also study the impact of Ordinals and other inscription activity on fee floors. Common mistakes include over-relying on single-estimator outputs during network upgrades or ignoring timezone-specific activity patterns that affect mempool clearing speeds. Avoiding these pitfalls requires maintaining a diversified set of data sources and regularly back-testing signals against historical price data.
FAQ: Fee-Based Trading Signals
How reliable are fee spikes as leading indicators?
Fee spikes show moderate leading correlation with volatility but perform best when combined with volume and on-chain activity metrics rather than used in isolation.
Should traders always wait for low fees before transacting?
Not necessarily. During strong directional moves, paying elevated fees can secure faster execution and protect against slippage that exceeds the fee cost.
Do halving-related fee increases repeat predictably?
Patterns recur but magnitude varies with overall network demand. Historical context helps set expectations without guaranteeing outcomes.
How do layer-two solutions affect base-layer fee dynamics?
Layer-two adoption can reduce base-layer demand during normal periods yet increase it during mass settlement events, creating predictable congestion windows that informed traders can anticipate.
What role do institutional flows play in 2026 fee markets?
Large institutional transfers often pay premium fees to ensure rapid confirmation, creating temporary distortions that retail traders can monitor for timing clues.
Conclusion
Mastering Bitcoin fee market dynamics equips 2026 traders with a powerful supplementary dataset. By combining mempool analysis, estimation tools, and historical context, analysts can refine timing and manage risk more effectively across market regimes. Consistent application of these techniques supports more informed position management and improved overall trading performance.
No comments yet. Be the first!