 CryptoChain Blog
Introduction to the Bitcoin Stock-to-Flow Model
The stock-to-flow (S2F) model has become a cornerstone for analyzing Bitcoin's price behavior by quantifying scarcity. As we approach 2026, following the 2024 halving, understanding S2F helps forecast supply shocks and market responses. This guide delves into its mechanics, historical performance, and adaptations for current market conditions including institutional participation. Bitcoin's fixed supply cap of 21 million coins creates inherent scarcity that S2F captures through mathematical relationships between existing holdings and new issuance. Traders and analysts rely on this framework to contextualize price movements amid evolving network dynamics and macroeconomic influences.
Understanding Stock-to-Flow Fundamentals
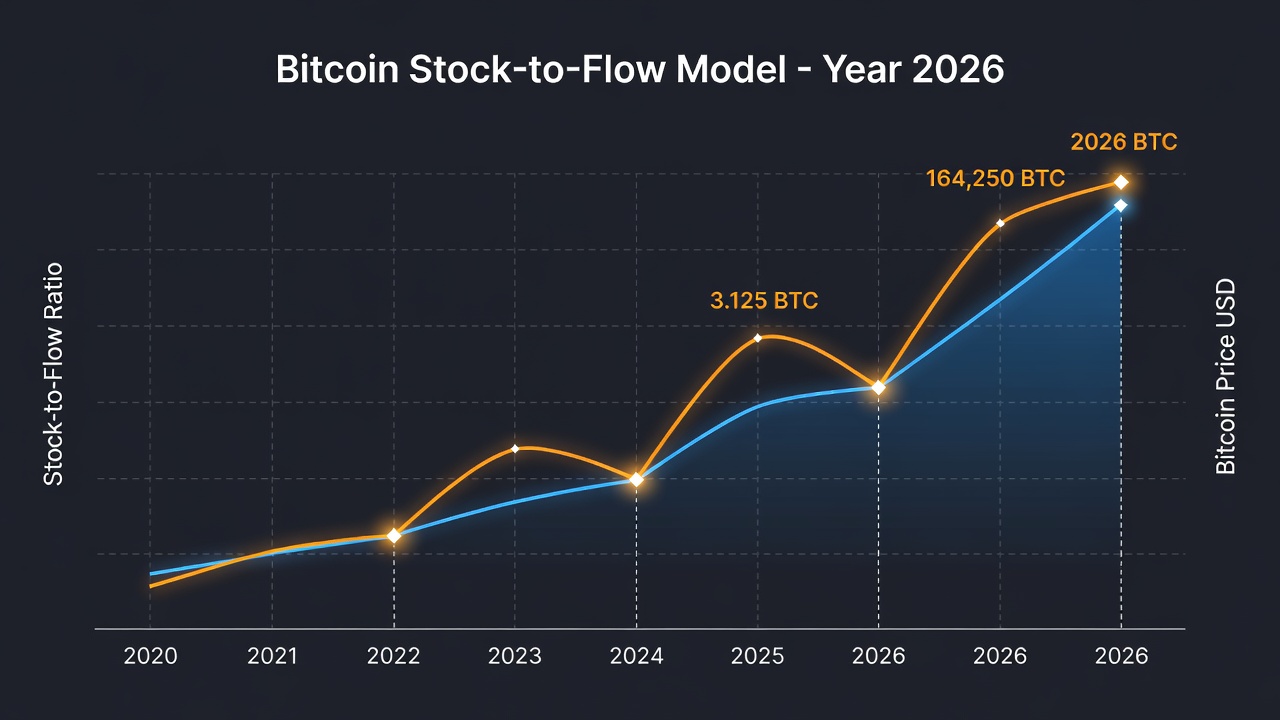
Stock-to-flow measures the ratio of existing Bitcoin supply (stock) to annual production (flow). Higher ratios indicate greater scarcity, historically correlating with price increases. The formula is straightforward: S2F = Stock / Flow. For Bitcoin, stock represents the total mined supply, while flow equals the annual issuance rate, which halves every 210,000 blocks. This scarcity metric draws parallels to precious metals like gold, where high stock-to-flow ratios support value retention over time. In 2026 the model gains renewed attention because issuance has stabilized at lower levels post-halving, amplifying the impact of any demand shifts.
Key Calculations Explained
To compute S2F in 2026, start with the post-2024 halving issuance of 3.125 BTC per block. With approximately 144 blocks daily, annual flow equals roughly 164,250 BTC. Total stock as of mid-2026 would exceed 19.8 million BTC. Traders can replicate this using on-chain data from public explorers. Step-by-step: 1) Retrieve current block height. 2) Calculate remaining blocks to next halving. 3) Apply the issuance schedule. This yields precise S2F values for modeling. For example, dividing 19.85 million BTC stock by 164,250 annual flow produces an S2F ratio near 121, highlighting extreme scarcity compared to earlier cycles. Analysts often adjust for lost coins estimated at 20 percent of supply to refine the effective stock figure.
Historical Accuracy and Chart Interpretations
Backtests show S2F captured major bull cycles with reasonable accuracy, particularly pre-2021. Charts typically plot S2F against logarithmic price scales, revealing power-law relationships. In 2026, interpret deviations by overlaying realized price metrics, which reflect the average on-chain acquisition cost. Historical data from 2012, 2016, and 2020 halvings demonstrate how S2F peaks aligned with price surges, though variance increased in later cycles due to maturing markets. 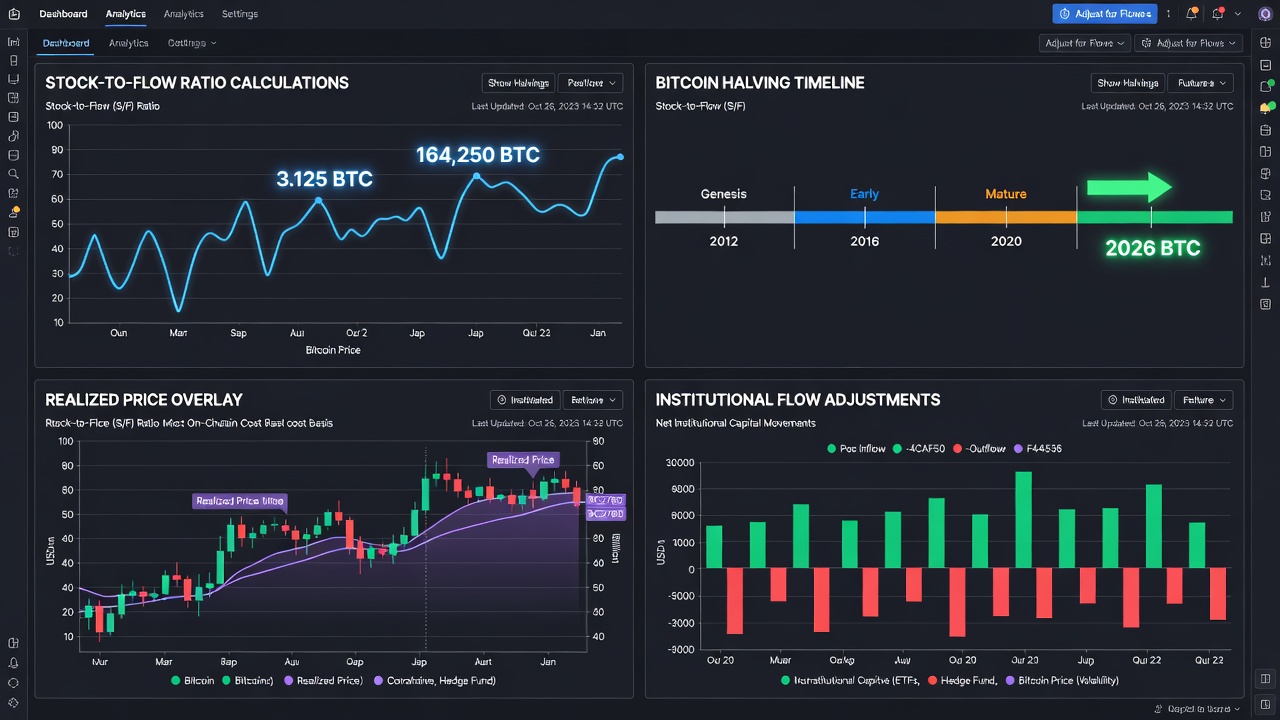
Chart reading involves identifying crossovers between S2F-derived price bands and actual market prices. When prices trade below the model line, historical patterns suggest accumulation opportunities, while deviations above may indicate overextension.
Post-Halving Supply Dynamics in 2026
The 2024 halving reduced daily issuance dramatically, setting the stage for 2026 price discovery. Supply dynamics now factor in lost coins and long-term holder behavior. On-chain metrics like realized price provide context, often acting as dynamic support levels during corrections. Miners' selling pressure has evolved with institutional custody solutions, reducing immediate sell-side flows compared to prior cycles. Additionally, the growing proportion of coins held for over one year signals stronger conviction among participants, which can magnify scarcity effects captured by S2F.
Limitations When Applied to 2026 BTC Analysis
While insightful, S2F overlooks demand shocks, regulatory changes, and macroeconomic variables. It assumes constant miner behavior and does not account for Lightning Network adoption or layer-2 scaling. Common pitfalls include over-reliance during bear markets where correlation breaks down. Another limitation arises from its static treatment of supply without incorporating velocity or transaction volume trends. Regulatory developments such as ETF approvals or taxation changes can override scarcity signals temporarily. Finally, the model performs less reliably during periods of extreme leverage in derivatives markets that distort spot price discovery.
Comparisons with On-Chain Metrics
Pairing S2F with realized price and MVRV ratios offers a fuller picture. Realized price, calculated as total USD value divided by supply, highlights undervaluation zones. Institutional flows, tracked via exchange reserves, can be integrated by modeling net ETF accumulation rates. For deeper on-chain analysis, resources like Blockchain.com provide transparent explorer tools. Combining S2F with Puell Multiple or Hash Ribbons adds layers of confirmation for timing decisions. These hybrid approaches mitigate single-metric blind spots and improve robustness across market regimes.
Building Simple S2F Dashboards: Step-by-Step Examples
Creating a functional dashboard requires integrating multiple data streams. Begin by sourcing block height and issuance data from public APIs. Next, calculate daily flow and cumulative stock in a spreadsheet. Overlay historical price data and add realized price as a secondary series. Incorporate institutional inflow estimates from public reports. Finally, automate alerts for S2F ratio shifts exceeding defined thresholds. This approach enables daily workflow integration for spotting entry points. Advanced users can extend the dashboard with Python scripts pulling live data to visualize projected S2F trajectories through 2028.
Backtesting Scenarios Using 2026 Data
Simulate post-halving periods by replaying 2012 and 2016 cycles adjusted for today's market cap. Results suggest potential upside if scarcity narratives hold, tempered by broader adoption curves. One scenario models 15 percent annual demand growth against fixed issuance, projecting price bands. Another incorporates ETF inflow assumptions of several billion dollars monthly to assess supply absorption capacity. Backtesting reveals that S2F signals strengthen when combined with volume confirmation and avoid false positives during low-liquidity periods.
Debunking Common Myths
Myth one: S2F guarantees price targets. Reality: it is a scarcity indicator, not a crystal ball. Myth two: It ignores all external factors. In truth, refined models blend S2F with macro data for better robustness. Myth three: The model becomes obsolete after multiple halvings. Evidence shows ratios continue rising, maintaining relevance. For authoritative Bitcoin fundamentals, refer to Bitcoin.org. Additional context on financial modeling appears at Investopedia.
Practical Trader Takeaways
Integrate S2F into routines by monitoring monthly updates alongside volume and sentiment indicators. Avoid trading solely on model signals; combine with risk management. Focus on long-term scarcity trends rather than short-term noise for sustainable strategies. Develop a checklist: review S2F monthly, cross-reference with realized price, assess institutional flows, and size positions conservatively. This disciplined method supports informed decision-making amid 2026 volatility.
Conclusion
The stock-to-flow model remains a valuable lens for 2026 Bitcoin analysis when used judiciously alongside complementary metrics. By mastering calculations, recognizing limitations, and applying practical examples, traders gain actionable insights into supply-driven price movements. Continued refinement through on-chain data and institutional adjustments will keep the framework relevant as the network matures.

No comments yet. Be the first!