 CryptoChain Blog
Introduction to HODL Waves in Bitcoin Analysis
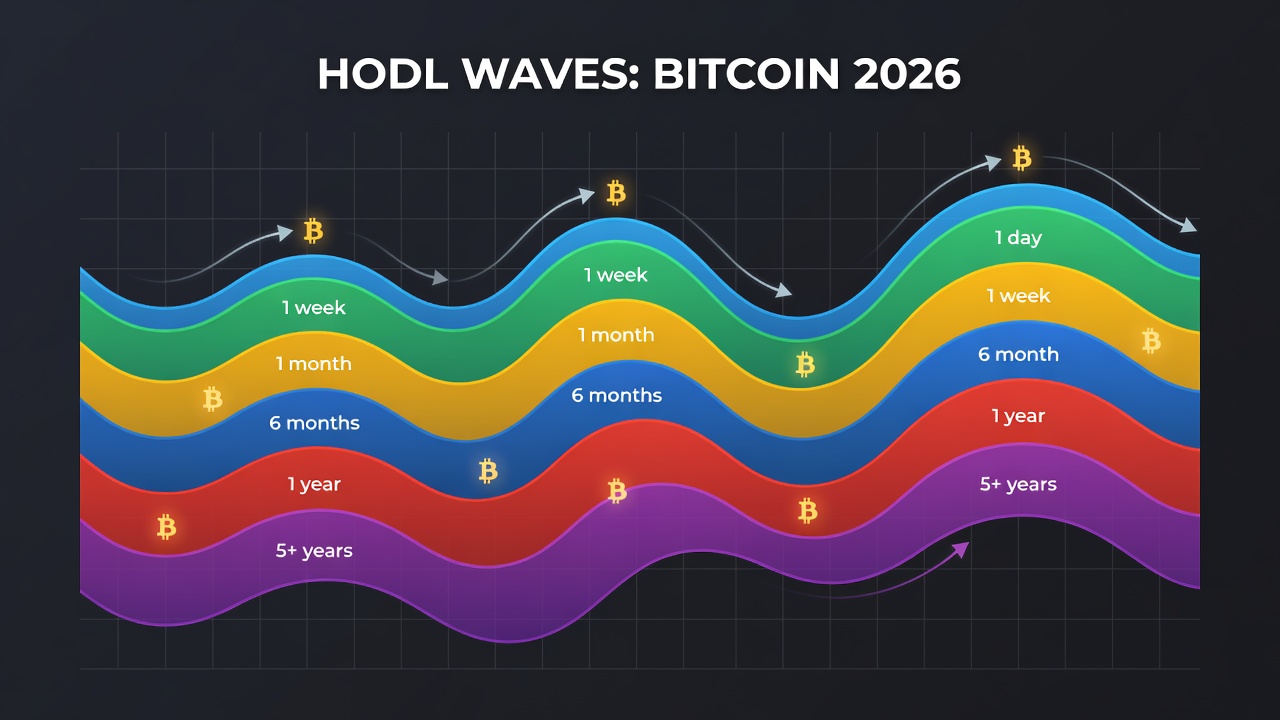
HODL waves provide a powerful on-chain lens for examining how long-term Bitcoin holders behave during different market phases. By visualizing the age distribution of unspent transaction outputs (UTXOs), these waves help traders and analysts identify accumulation periods, potential distribution points, and overall holder conviction. In 2026, with Bitcoin's evolving market structure driven by institutional participation and regulatory clarity, understanding these patterns becomes essential for anticipating cycle shifts and making informed decisions. This technique offers insights that traditional price charts alone cannot reveal, allowing users to see the underlying supply dynamics that influence future price movements.
This methodology breaks down coins into distinct age bands, such as 1-day to 1-week, 1-week to 1-month, 1-3 months, 3-6 months, 6-12 months, 1-2 years, 2-3 years, 3-5 years, and 5+ years. Each band forms a wave that expands or contracts based on spending and holding activity. As of mid-2026, long-term holders continue to dominate the supply, reflecting strong conviction amid institutional adoption and macroeconomic uncertainties. The waves create a visual representation of Bitcoin's lifecycle, showing how coins mature over time without being spent.
What Are HODL Waves and How Do They Work?
HODL waves originated from on-chain analytics platforms that aggregate Bitcoin's UTXO set by age. When coins remain unspent, their wave grows; when spent, it shrinks and shifts to younger bands. This creates a stacked area chart that visually represents the lifecycle of Bitcoin holdings. The data comes directly from the blockchain, making it transparent and verifiable without relying on centralized exchanges.
The methodology relies on transparent blockchain data. For example, a surge in the 3-6 month band often signals new accumulation after a price dip, while contraction in older bands may indicate profit-taking by early adopters. In 2026, analysts track these shifts to gauge whether retail or institutional players drive momentum. Understanding the mechanics involves recognizing that every Bitcoin transaction resets the age clock for the spent coins, moving them into the youngest band and allowing waves to reflect real-time holder behavior across the network.
Interpreting Wave Patterns for Market Cycles
Wave patterns reveal cycle stages with remarkable clarity. During bull markets, older waves compress as holders sell into strength, redistributing supply to newer participants. In bear phases or early recoveries, younger waves expand as new buyers enter and hold through volatility. By 2026, the dominance of 1-year+ bands suggests a maturing market with reduced volatility from long-term supply, as more coins lock into higher age categories.
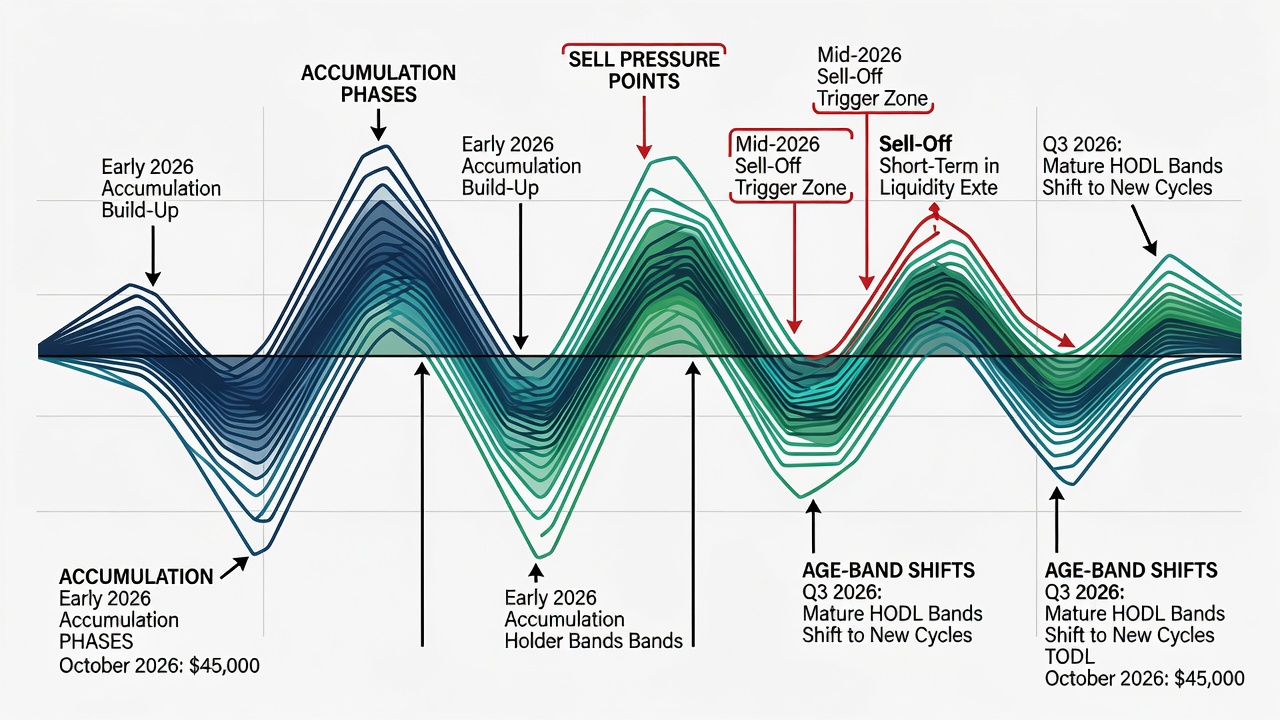
Key signals include expansion of 6-12 month waves, which often precedes rallies as accumulation intensifies among mid-term holders. Contraction in 2-5 year waves may highlight distribution zones near cycle tops, while stability in 5+ year bands indicates diamond-hand holders resisting sell pressure even during sharp corrections. These patterns help differentiate between healthy growth fueled by conviction and speculative froth driven by short-term traders. Additional context comes from observing how waves interact with halving events or macroeconomic announcements that occurred in early 2026.
Comparing HODL Wave Data Against Price Action
Aligning waves with price charts adds critical context for analysis. In early 2026, Bitcoin's price action showed resilience despite macroeconomic headwinds, coinciding with steady growth in the 1-2 year age band. This divergence from shorter-term waves highlighted strong underlying demand that price alone might overlook. Traders cross-reference wave data with metrics like realized price or MVRV ratios for confirmation, creating a multi-layered view of market health.
When price rises while older waves remain stable, it often validates sustainable uptrends rather than short squeezes. Conversely, rising prices paired with shrinking older bands can warn of impending corrections. Historical comparisons from 2024 and 2025 data demonstrate how similar wave configurations preceded major moves, providing a framework for 2026 interpretations.
Identifying Shifts Among Different Age Bands of Coins
Age-band analysis uncovers cohort behavior in detail. Short-term holders (under 1 month) react quickly to news, causing rapid wave fluctuations that reflect sentiment swings. Mid-term bands (1-12 months) reflect tactical positioning by traders and investors responding to emerging trends. Long-term bands (1+ years) move slowly, providing a baseline for overall market health and conviction levels.
In 2026 data, a noticeable migration from 3-6 month to 6-12 month bands pointed to holders extending their commitment after initial accumulation. Monitoring these transitions helps spot when accumulation phases transition into distribution. For instance, if 1-2 year waves begin to shrink while price plateaus, it may indicate early profit-taking by a growing cohort of holders who entered during the previous cycle.
Free Tools for HODL Wave Visualization
Several platforms offer free or accessible HODL wave charts suitable for both beginners and professionals. Glassnode provides detailed UTXO age visualizations with customizable bands and historical overlays. Bitcoin.org resources link to open-source explorers for raw data verification and educational materials on blockchain fundamentals. Additional options include on-chain dashboards from established analytics providers that update daily and allow users to export data for further study.
Step-by-Step Examples of Analyzing 2026 Data
Follow these steps to analyze recent waves effectively:
- Access a visualization tool and select the HODL waves metric with a focus on 2026 timeframe.
- Filter for relevant age bands and overlay Bitcoin price action for direct comparison.
- Observe band expansions: Note growth in 1-year+ waves during consolidation periods as a sign of strengthening holder base.
- Identify sell pressure: Watch for shrinkage in older bands coinciding with price peaks or high trading volume.
- Validate with volume and other metrics: Cross-check against on-chain transaction counts and exchange inflows.
- Document patterns over multiple weeks to distinguish noise from meaningful trends.
Applying this process to Q2 2026 data revealed a pronounced 2-3 year wave expansion, aligning with institutional inflows and reduced exchange reserves that supported price stability.
Practical Trading Applications
Investors use HODL waves to time entries during accumulation signals and exits ahead of potential distribution. For instance, a stable 5+ year wave combined with rising prices supports long bias with higher confidence. Conversely, rapid aging of coins into older bands after rallies may prompt caution and partial profit-taking. Combine with other on-chain indicators such as active addresses or realized cap for robust strategies, always considering broader market context including regulatory developments in 2026. Risk management remains essential, as waves provide probabilistic insights rather than guarantees.
Limitations and Common Mistakes to Avoid
While powerful, HODL waves have limitations including potential distortion from large custodial movements or lost coins that never move. Beginners often mistake short-term fluctuations for cycle signals, leading to premature trades. Always use multiple timeframes and combine with price and volume analysis. Avoid over-reliance on any single metric, as external factors like ETF flows or global events can override on-chain patterns temporarily.
Short FAQ on Wave Reliability
Are HODL waves reliable for predicting price movements?
They offer probabilistic insights into holder behavior but should be combined with multiple indicators rather than used in isolation for trading decisions.
How often do waves update?
Most platforms refresh daily based on blockchain confirmations, capturing real-time shifts in UTXO ages across the network.
Can short-term noise distort long-term wave signals?
Yes, but focusing on 6+ month bands filters much of the noise for clearer cycle views and more reliable trend identification.
What role do institutional holders play in 2026 wave patterns?
Institutional activity often appears in mid-to-long term bands as large purchases mature, contributing to stability in higher age categories during volatile periods.
Conclusion
HODL waves deliver nuanced visibility into Bitcoin's holder dynamics for 2026 and beyond. By mastering age-band interpretation and pairing it with price action, market participants gain an edge in navigating cycles. Regular analysis with reliable tools empowers informed decisions in an increasingly data-driven ecosystem, helping both new and experienced users understand the forces shaping Bitcoin's future trajectory.

No comments yet. Be the first!