 CryptoChain Blog

Bitcoin Mempool Signals: 2026 Trader Fee Strategies
In 2026, Bitcoin traders increasingly rely on mempool data to anticipate fee market shifts and optimize transaction timing. The mempool acts as a real-time window into network demand, revealing congestion patterns that directly influence confirmation speeds and costs. This guide delivers actionable strategies for interpreting live data, predicting fees, and managing risk during volatile periods. Understanding these signals has become essential as Bitcoin adoption grows and institutional flows create more frequent spikes in activity.
Understanding the Bitcoin Mempool in 2026
The mempool is the holding area for unconfirmed transactions awaiting inclusion in a block. In 2026, with growing adoption of layer-2 solutions and institutional activity, mempool dynamics have become more nuanced yet remain a core indicator for fee estimation. Traders monitor mempool size, transaction count, and fee distribution to forecast when fees will spike or stabilize. The mempool reflects pending demand across the network, and its state changes constantly as new transactions arrive and blocks are mined. Depth refers to the cumulative backlog at each fee rate level, while the overall size indicates total pending data. In periods of low activity, the mempool clears quickly, allowing even modest fees to secure fast confirmations. During high-demand events, however, lower-fee transactions can linger for hours or longer.
Key concepts include mempool depth, which measures the backlog of transactions sorted by fee rate, and spike patterns that signal sudden surges in demand, often triggered by market events or batch settlements. These patterns help traders distinguish between temporary noise and sustained pressure on the fee market.
Interpreting Mempool Depth and Spike Patterns
Mempool depth provides insight into how long a low-fee transaction might wait. A deep mempool with many high-fee transactions at the top suggests elevated competition. Traders examine the fee histogram to identify the minimum rate needed for next-block confirmation. Depth is visualized through layered charts that show how many transactions sit at each fee tier, allowing quick assessment of the competitive landscape.
Spike patterns appear as rapid increases in transaction volume at specific fee levels. These often precede fee market shifts and can be tracked using free visualization tools. Recognizing early spikes allows traders to adjust their bids before congestion peaks. For example, a sudden cluster of transactions at mid-range fees may indicate an impending wave of high-priority activity from exchanges or large holders. Traders who monitor these patterns in real time can decide whether to accelerate their own transactions or wait for the backlog to ease.
Network Health Indicators and Free Tools
Beyond raw depth, network health indicators such as average block time, hash rate stability, and relay policy changes help contextualize mempool signals. Healthy networks with consistent block production tend to clear backlogs faster even during moderate congestion. When hash rate remains steady and blocks arrive on schedule, the mempool acts as a reliable predictor. Disruptions in block intervals can amplify congestion, making it critical to watch these metrics alongside depth data.
Free tools like mempool.space offer live dashboards, historical charts, and fee estimators. Additional resources from bitcoin.org provide foundational documentation on transaction propagation and fee markets. Another useful reference is the developer documentation available at developer.bitcoin.org, which explains core concepts behind transaction relay and mempool behavior in detail.
Step-by-Step Techniques for Fee Prediction
- Load a live mempool explorer and filter by fee rate bands to isolate relevant segments of the backlog.
- Analyze the last 24 hours of depth changes to establish baseline congestion levels and identify any emerging trends.
- Identify spike patterns by comparing current volume against historical averages from similar times of day or market conditions.
- Cross-reference with upcoming network events such as difficulty adjustments or known batch settlement windows.
- Simulate your transaction fee using the explorer's estimator and adjust for urgency based on your trading timeline.
- Document observations in a personal log to build intuition over multiple market cycles.
These steps help convert raw data into predictive insights for 2026 trading decisions and can be repeated throughout the trading day for ongoing adjustments.
Real 2026 Examples of Fee Market Shifts
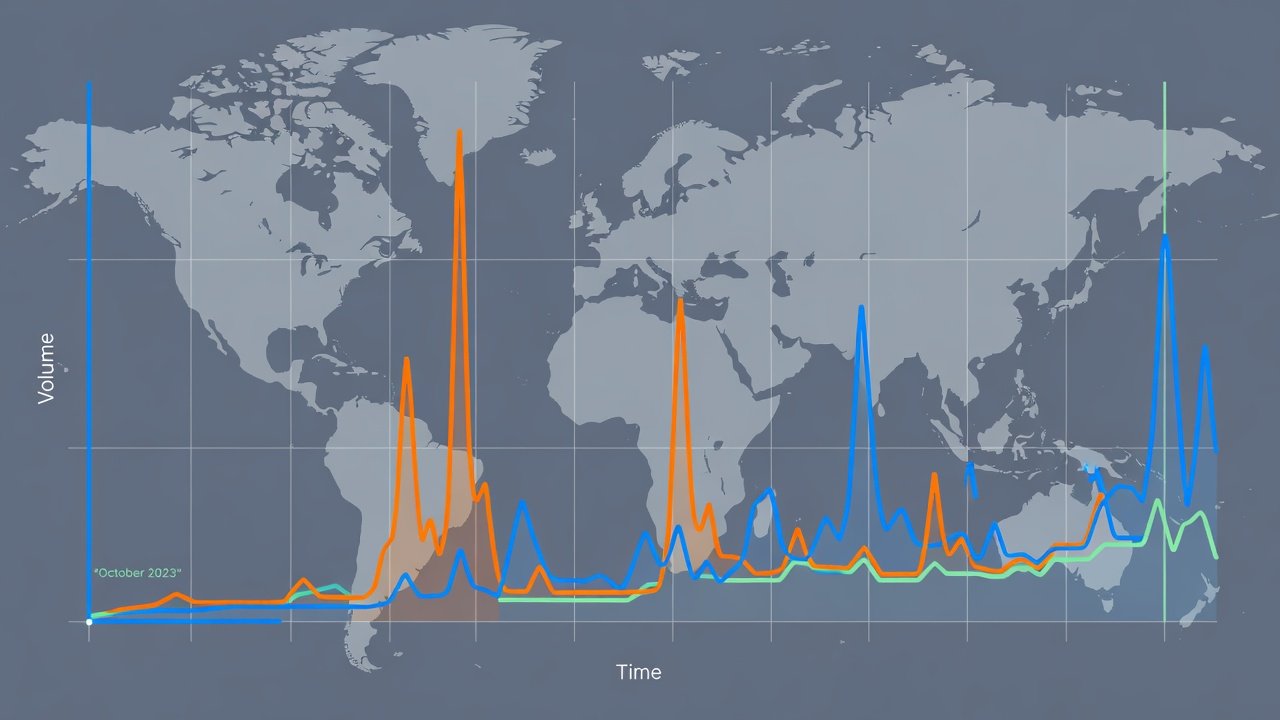
During early 2026 market rallies, mempool depth doubled within hours as traders rushed to move funds. One notable spike saw rapid increases in pending transactions before settling once the initial wave cleared. Traders who monitored depth in real time avoided overpaying by waiting for the subsequent lull. Another example involved a protocol upgrade that temporarily altered relay policies, creating uneven fee distribution visible only through detailed mempool analysis. In one case, a large institutional transfer cluster caused a visible spike at higher fee tiers, prompting retail traders to delay non-urgent movements until the congestion eased after several blocks.
Comparisons to Historical Cycles
Compared to 2021 and 2024 cycles, 2026 mempool behavior shows faster recovery times due to improved node software and larger block weight efficiency. However, the amplitude of spikes remains similar during high-volatility periods, underscoring the value of consistent monitoring regardless of cycle stage. In earlier cycles, prolonged backlogs were common during bull runs, whereas 2026 networks recover more quickly thanks to better propagation optimizations. This evolution means traders must focus more on the speed of spike formation rather than just absolute depth levels.
Integrating On-Chain Metrics
Combine mempool signals with on-chain data such as exchange inflows, UTXO age distribution, and realized price metrics. This layered approach reveals whether congestion stems from speculative trading or long-term accumulation, refining fee timing accuracy. For instance, rising exchange inflows paired with mempool spikes often signal short-term selling pressure, while aging UTXOs during calm mempool periods may indicate accumulation phases. Traders who integrate these datasets gain a fuller picture of market intent behind the congestion.
Practical Checklists for Timing Entries and Risk Management
Pre-Trade Checklist
- Review current mempool depth and top fee rates across multiple time windows to confirm trends.
- Confirm no major network events scheduled within the next 6 hours that could trigger additional volume.
- Set a maximum fee threshold aligned with your strategy risk tolerance and position size.
- Verify wallet support for advanced features like replace-by-fee before broadcasting.
High-Congestion Risk Management
- Batch transactions where possible to reduce overall exposure to elevated fees.
- Use replace-by-fee (RBF) for flexibility during prolonged spikes without committing to high initial rates.
- Monitor for sudden clearing events that may create brief low-fee windows for follow-up activity.
- Document observed patterns to refine future predictions and avoid repeating costly mistakes.
- Maintain a reserve of confirmed UTXOs for emergency needs when the mempool is heavily congested.
Conclusion
Mastering Bitcoin mempool signals equips 2026 traders with a data-driven edge for fee optimization. By combining depth analysis, spike recognition, and on-chain context, traders can time entries more effectively while controlling costs during congestion. Consistent application of these techniques supports better decision-making across varying market conditions.
FAQ
How often should I check mempool data for trading?
Active traders review data multiple times daily, especially ahead of anticipated volatility or large transfers, to stay ahead of rapid changes.
Can mempool signals predict exact fee rates?
They provide strong directional guidance but exact rates depend on real-time block production and competing demand at any given moment.
Are free tools sufficient for professional analysis?
Yes, platforms like mempool.space deliver comprehensive live and historical data suitable for most trading strategies without requiring paid subscriptions.
What happens if I ignore congestion signals?
Transactions may confirm slowly or require expensive fee bumps, increasing overall trading costs and potentially impacting strategy returns.
How do layer-2 solutions affect mempool dynamics in 2026?
Layer-2 activity can reduce on-chain pressure during normal periods but still contributes to spikes when large settlements occur, making monitoring essential.
No comments yet. Be the first!