 CryptoChain Blog
Understanding Bitcoin Funding Rate Spikes in 2026
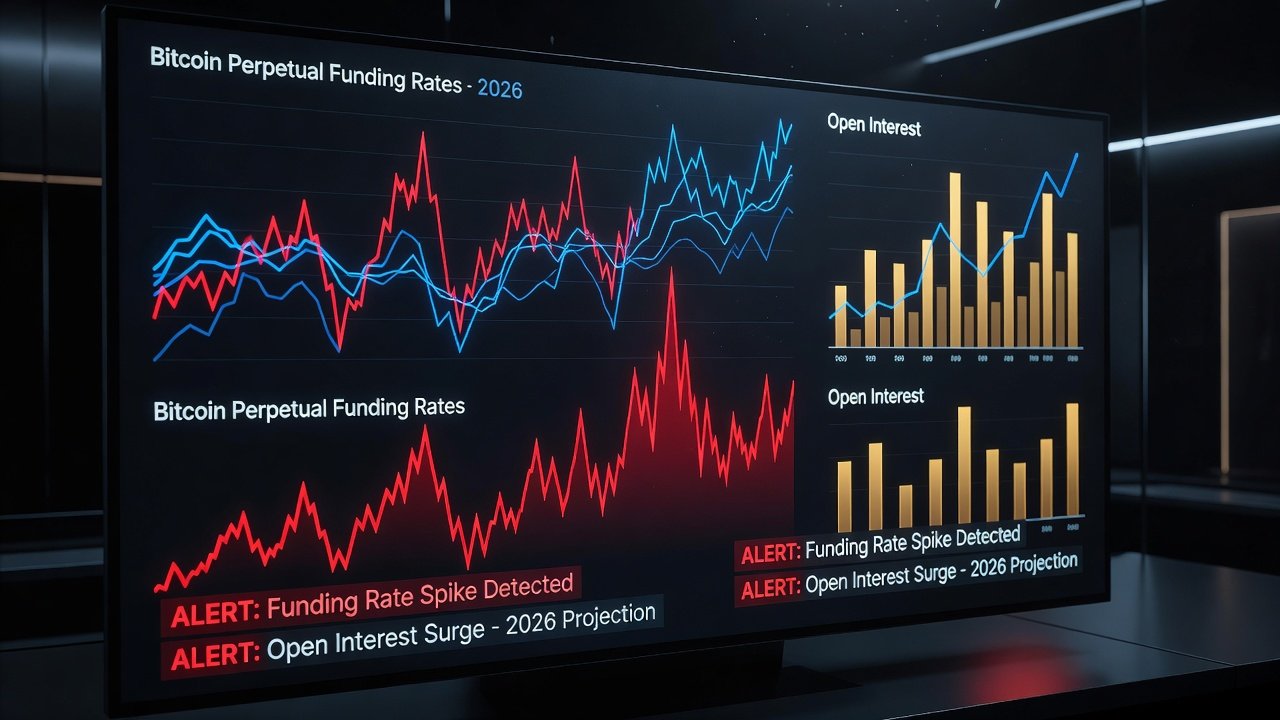
Bitcoin perpetual futures funding rates serve as a key sentiment gauge in crypto derivatives markets. When these rates spike to extreme levels, they often precede significant price reversals. For traders targeting 2026 opportunities, recognizing these spikes provides actionable timing edges beyond standard perpetual futures strategies. Funding rates act as a built-in mechanism to balance long and short positions in perpetual contracts, which lack expiration dates unlike traditional futures. In 2026, with increased institutional participation and evolving market microstructure, these spikes have become even more pronounced during periods of high leverage and rapid sentiment shifts.
Extreme positive spikes indicate over-leveraged long positions, while negative spikes highlight short-side overcrowding. Both scenarios create conditions ripe for liquidation cascades and trend shifts. Advanced traders monitor these metrics closely because they reflect real-time crowd psychology and can highlight when markets are stretched beyond sustainable levels.
Mechanics Behind Funding Rate Spike Formation
Funding rates are calculated every eight hours on most exchanges to keep perpetual contract prices aligned with spot markets. The rate equals the difference between the perpetual contract price and the spot price, adjusted by open interest and trader positioning. When the perpetual trades at a premium to spot, longs pay shorts; the reverse occurs during discounts. Spikes form when aggressive buying or selling drives the contract premium or discount far beyond historical norms. High open interest amplifies this effect as more capital chases the same directional bet. Volume surges often accompany these moves, confirming conviction but also signaling potential exhaustion.
Additional factors include exchange-specific fee structures, cross-margining effects, and the influence of large whale wallets that can tilt funding calculations rapidly. In 2026, algorithmic trading bots have accelerated spike formation, making real-time monitoring essential for timely entries and exits.
Historical Case Studies from Prior Cycles
During the 2021 bull market peak, funding rates exceeded 0.1% per eight-hour period multiple times before major corrections. Similar patterns appeared in early 2024 when rates briefly hit extreme positives ahead of a 20% drawdown. These episodes demonstrate how spikes act as contrarian signals across cycles. In the 2017-2018 cycle, negative funding rate spikes preceded sharp rebounds after capitulation events, offering early entry points for patient traders.
Analyzing open interest alongside rates reveals whether spikes reflect genuine momentum or crowded trades vulnerable to reversal. Traders who combined these metrics avoided several false breakouts in 2022-2023. For 2026, historical parallels suggest that prolonged positive spikes above 0.08% often coincide with local tops, especially when accompanied by record open interest levels. Reviewing these past events helps calibrate expectations and avoid emotional decision-making during live market conditions.
Integrating Open Interest and Volume Data
Funding rate spikes gain predictive power when cross-referenced with open interest growth and volume profiles. Rising open interest during a positive spike suggests new longs are entering, increasing reversal risk. Declining open interest with falling volume may indicate a fakeout rather than a sustainable move. Volume data adds another layer, showing whether the spike is supported by broad participation or driven by thin liquidity.
Free dashboards from DeFiLlama and major exchange data portals allow real-time monitoring of these metrics across Bitcoin perpetual pairs. Combining these with on-chain metrics from sources like Coin Metrics provides a fuller picture of market health. Traders should track 24-hour volume changes and open interest deltas to confirm whether a spike represents a high-probability reversal setup.

Step-by-Step Alert Setup Using Free Dashboards
- Register for a free account on a derivatives analytics platform that tracks funding rates and open interest.
- Set custom alerts for Bitcoin perpetual funding rates crossing +0.05% or -0.05% thresholds, adjusting sensitivity based on historical volatility.
- Layer in open interest change filters exceeding 5% within a four-hour window to capture meaningful positioning shifts.
- Configure volume spike notifications to confirm conviction behind the rate movement and filter out low-liquidity anomalies.
- Test alerts on historical data to calibrate sensitivity and reduce noise, focusing on periods like the 2021 and 2024 cycles.
- Integrate multi-exchange aggregation to avoid single-platform distortions and ensure alerts reflect global market conditions.
Spotting Fakeouts Versus Genuine Signals
Genuine reversal signals typically show funding rate spikes paired with diverging open interest and weakening volume. Fakeouts often occur when rates spike but open interest continues climbing without corresponding spot market confirmation. Practical example: In mid-2025 scenarios, a +0.08% spike coincided with flat open interest and declining spot volume, correctly flagging a short-term pullback rather than a trend change. Another case involved a negative spike during low-volume hours that quickly reversed when institutional buying entered, highlighting the importance of waiting for confirmation.
Always wait for at least one confirming candle close before acting. Cross-check with broader market context such as macroeconomic news or Bitcoin halving cycle timing to distinguish sustainable moves from temporary distortions.
Risk Management Rules for 2026 Trades
- Size positions at no more than 1-2% of portfolio risk per spike-based entry to preserve capital during extended trends.
- Use stop-losses placed beyond recent swing highs or lows to account for volatility and prevent premature exits.
- Scale out profits in tranches as price approaches key support or resistance levels, locking in gains while allowing for further upside.
- Avoid trading during low-liquidity periods when spikes may produce unreliable readings and increase slippage risk.
- Review positions daily and adjust alerts as market regimes evolve, incorporating new data from 2026-specific volatility patterns.
- Maintain a trading journal documenting each spike trade outcome to refine strategies over time.
FAQ: Common Trader Mistakes with Funding Rate Spikes
How often should I check funding rate data?
Monitor dashboards at least twice daily during volatile periods, but rely on automated alerts to avoid over-trading and emotional interference.
Do spikes always lead to reversals?
No. Extreme readings increase probability but require confirmation from open interest and volume to filter noise and reduce false signals.
Which exchanges provide the most reliable data?
Focus on platforms with transparent reporting and high Bitcoin perpetual volume for accurate aggregate metrics, cross-verifying across multiple venues.
What role does leverage play in amplifying spikes?
High leverage magnifies both the formation of spikes and subsequent liquidation events, making risk controls even more critical for 2026 trading.
Conclusion
Bitcoin funding rate spikes offer advanced traders a powerful lens for 2026 entry and exit timing. By mastering spike mechanics, integrating complementary data, and applying disciplined alert setups with strict risk rules, market participants can position themselves ahead of major reversals while avoiding common pitfalls. Consistent application of these principles, combined with ongoing education through resources like Investopedia, builds a robust framework for navigating volatile crypto markets.

No comments yet. Be the first!