 CryptoChain Blog

Introduction to Bitcoin Signal Fusion in 2026
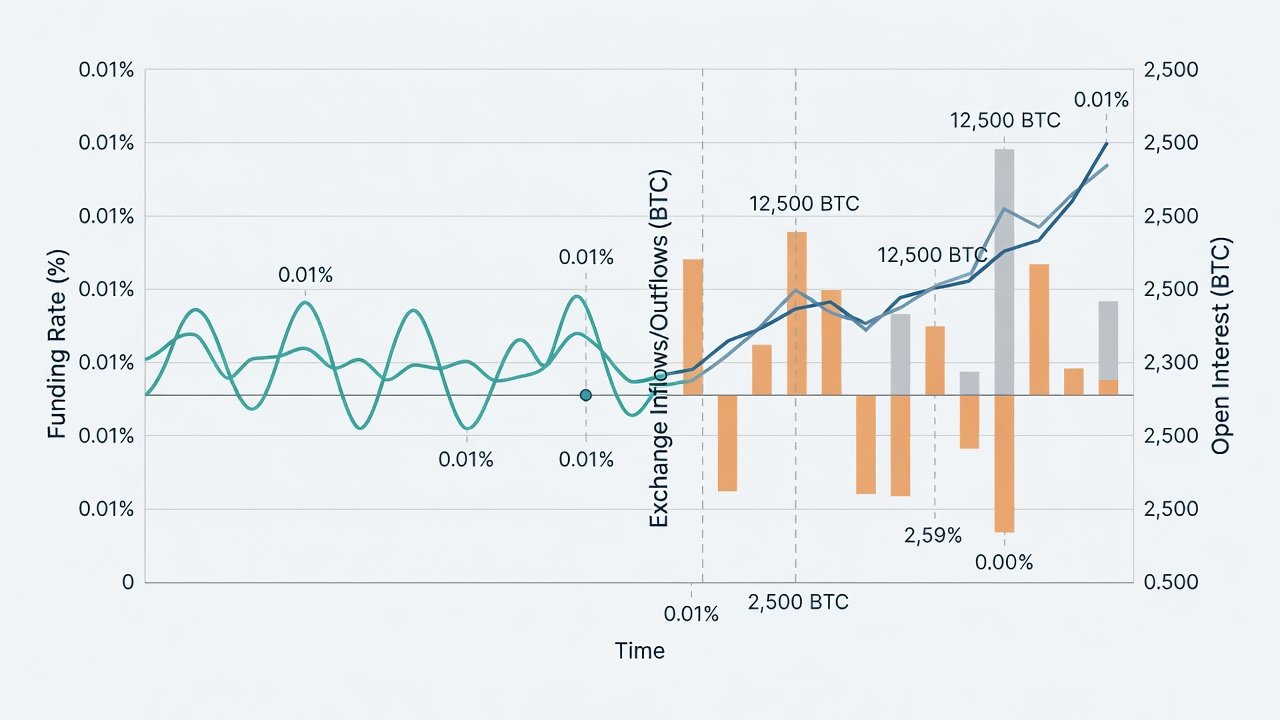
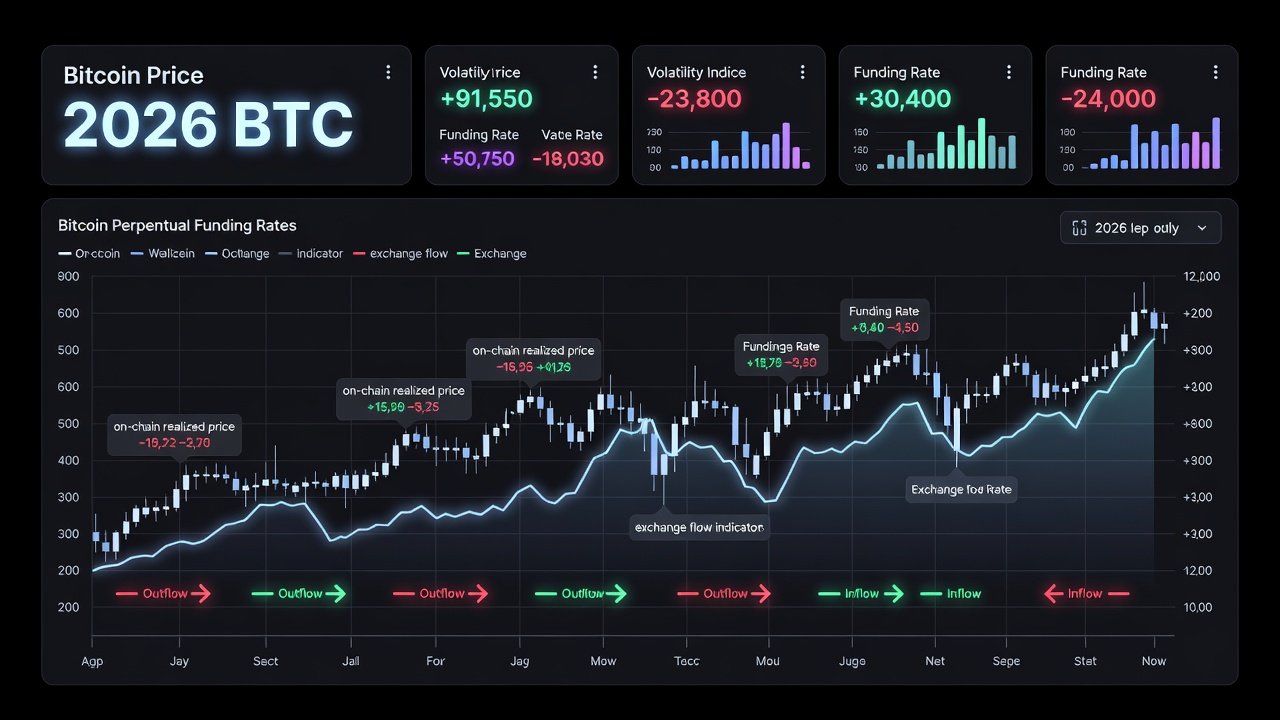
Traders in 2026 increasingly rely on combining Bitcoin perpetual futures funding rates with exchange inflow and outflow data to identify high-probability entry and exit points. This fusion approach provides clearer context than either metric alone, helping distinguish between temporary leverage spikes and genuine accumulation or distribution phases. By examining how funding extremes correlate with on-chain movements, market participants can anticipate reversals with greater confidence and reduce exposure to false signals that plague single-indicator strategies.
The growing sophistication of derivatives markets and on-chain analytics tools has made this integrated method accessible even to retail traders using free resources. In volatile conditions typical of Bitcoin cycles, relying solely on price action or one data stream often leads to suboptimal timing. Instead, cross-verifying sentiment from funding rates against actual coin movements on exchanges creates a more resilient decision framework that has proven effective across multiple market regimes.
Mechanics of Funding Rate Extremes
Bitcoin perpetual futures contracts use funding rates to keep prices aligned with spot markets. When rates turn strongly positive, long positions pay shorts, signaling overcrowded bullish leverage that can precede corrections. Negative rates indicate the opposite dynamic where shorts compensate longs. Extreme readings often precede reversals, but context from exchange flows is essential to confirm whether these extremes reflect healthy speculation or dangerous overcrowding that could unwind rapidly.
Funding rates are calculated periodically, typically every eight hours on major platforms, based on the difference between perpetual contract prices and spot indices. Traders monitoring these values over time notice that sustained extremes above or below certain thresholds tend to coincide with shifts in market participant behavior. Understanding the payment mechanics helps explain why prolonged positive funding can erode long positions through repeated costs, eventually forcing liquidations that accelerate downside moves.
Exchange Inflows, Outflows, and Price Correlation
Exchange inflows typically signal potential selling pressure as holders move coins to trading platforms for possible liquidation or distribution. Outflows suggest accumulation when investors withdraw to cold storage or private wallets. Historical patterns from 2024-2025 show that funding rate spikes accompanied by rising inflows frequently marked local tops, while negative funding paired with heavy outflows preceded strong rallies driven by reduced available supply on exchanges.
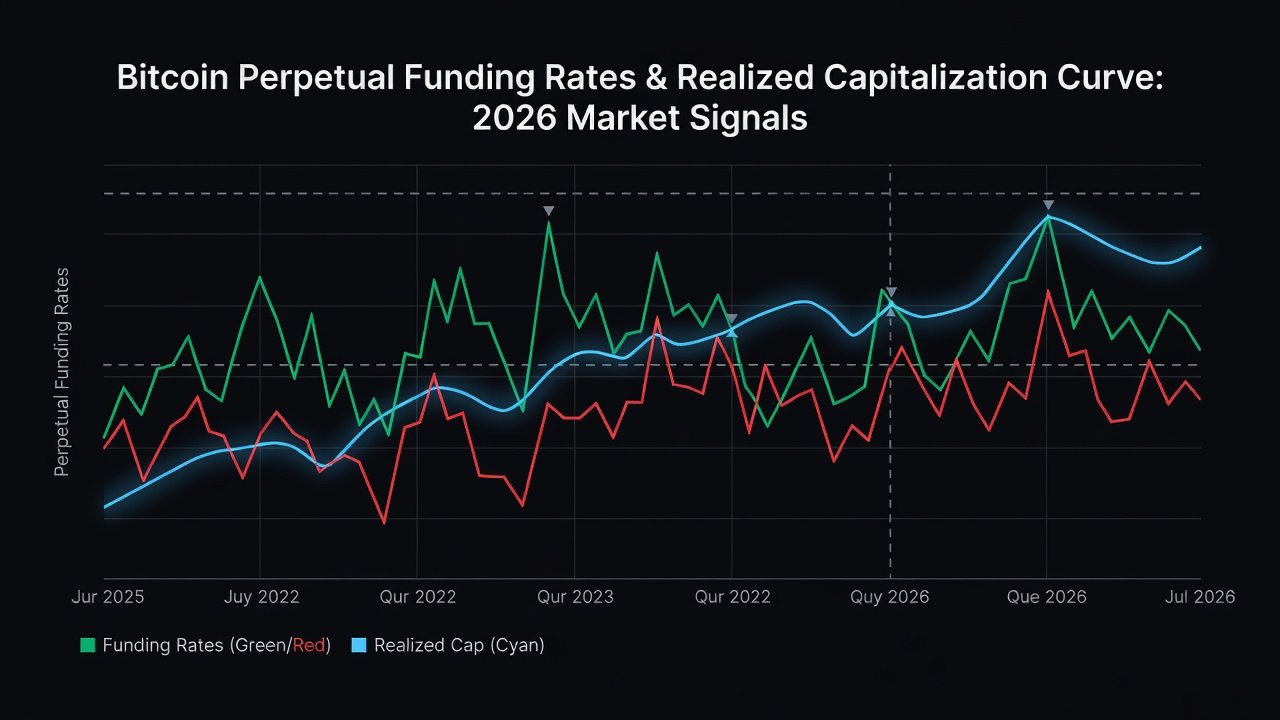
Realized price data adds another layer, revealing whether current market prices sit above or below the average cost basis of coins on exchanges. Divergences between funding sentiment and realized price often highlight reversal opportunities that pure technical analysis might miss. Net flow calculations, adjusted for known entity movements such as miner payouts or exchange treasury transfers, further refine the accuracy of these signals.
Historical Reversal Examples from 2024-2025
In mid-2024, a surge in positive funding rates above typical levels coincided with elevated exchange inflows, preceding a notable correction as leveraged longs were forced to unwind. Conversely, late 2025 saw deeply negative funding rates alongside consistent outflows that marked the start of a sustained uptrend fueled by institutional accumulation. These cases demonstrate how the combination filters out noise from isolated metrics and provides actionable confirmation.
Additional instances include early 2025 periods where moderate funding extremes paired with flat flows produced false signals until open interest data clarified the setup. By late 2025, another reversal was accurately flagged when funding turned positive while inflows accelerated, allowing prepared traders to reduce exposure ahead of the subsequent decline. Studying these episodes reveals recurring patterns that improve pattern recognition skills over time.
Step-by-Step Monitoring Workflow Using Free Tools
Follow this practical workflow to integrate both signals effectively:
- Track funding rates on major perpetual futures platforms via public dashboards updated in real time.
- Monitor exchange net flows using free on-chain explorers that aggregate Bitcoin movements to and from known addresses.
- Cross-reference with open interest trends to gauge overall leverage buildup across venues.
- Set custom alerts for funding thresholds combined with flow direction changes exceeding average daily volumes.
- Review realized price levels to validate whether current zones represent accumulation or distribution.
- Log historical correlations in a simple spreadsheet to backtest personal threshold preferences.
- Combine with broader market context such as macroeconomic events that might amplify or mute signals.
- Review weekly summaries to identify evolving regime shifts between bull and bear dynamics.
Integrating Open Interest for Stronger Signals
Open interest growth alongside extreme funding rates amplifies conviction in a potential reversal by confirming that new leverage is entering the market. Declining open interest during negative funding periods often confirms capitulation and sets the stage for recovery as weak hands exit. Traders should watch for divergences between open interest and price action as early warnings of building pressure that funding rates alone might understate.
Integrating these elements requires monitoring multiple timeframes, as short-term open interest spikes can distort longer-term trends. Successful users develop rules such as requiring open interest to rise for at least three consecutive days alongside funding extremes before acting on flow data. This layered approach minimizes whipsaws common in choppy market conditions.
Case Studies: Accumulation Zones and Exit Signals
One 2025 case study involved sustained outflows and negative funding rates that identified a major accumulation zone weeks before a breakout above key resistance levels. Participants who entered on the combined signal captured the subsequent rally while avoiding earlier false starts. Another example showed positive funding extremes plus inflow spikes that served as reliable exit signals ahead of a multi-week decline triggered by macroeconomic news.
A third case from 2024 highlighted how moderate funding paired with unusual outflow patterns preceded a short squeeze that caught many off guard. These fusions helped traders avoid false breakouts and time position adjustments effectively across varying volatility environments. Documenting each outcome in a trading journal reinforces learning and refines future application of the method.
Funding Rate Behavior: Bull vs Bear Phase Comparisons
During bull phases, positive funding rates tend to persist longer before reversing, reflecting sustained optimism and higher risk tolerance among participants. Bear markets produce sharper negative spikes that often coincide with capitulation outflows as leveraged positions are liquidated rapidly. Understanding these phase-specific behaviors allows traders to adjust thresholds dynamically and avoid misinterpreting normal bull-market leverage as immediate warning signs.
Comparisons also reveal that recovery phases after bear markets feature quicker normalization of funding rates once outflows stabilize. In contrast, late-stage bull markets show funding remaining elevated even as flows begin to turn, creating classic distribution setups. Adapting strategies to the prevailing regime improves overall win rates when applying the fusion technique.
FAQ: Common Trader Mistakes
- Ignoring context: Treating extreme funding rates in isolation without checking exchange flows leads to premature entries and unnecessary losses.
- Overlooking open interest: Failing to integrate leverage data misses confirmation of crowded trades that amplify reversals.
- Alert fatigue: Setting too many single-metric alerts instead of combined conditions reduces signal quality and increases missed opportunities.
- Neglecting realized price: Missing the average cost basis on exchanges can result in misidentifying true accumulation versus temporary dips.
- Short timeframes only: Focusing exclusively on intraday data without weekly or monthly context distorts interpretation of cycle-level shifts.
- Disregarding venue differences: Funding and flow dynamics vary across exchanges, requiring aggregation for accurate global signals.
Conclusion
Fusing Bitcoin funding rates with exchange flows creates a robust framework for 2026 trading decisions. By following structured workflows and studying historical patterns, traders gain an edge in spotting accumulation zones and timely exits. Consistent application of these combined signals supports more disciplined and informed market participation. For foundational Bitcoin concepts, visit Bitcoin.org and explore on-chain data resources at Blockchain.com.
No comments yet. Be the first!