 CryptoChain Blog
Introduction to Bitcoin On-Chain Signals for 2026
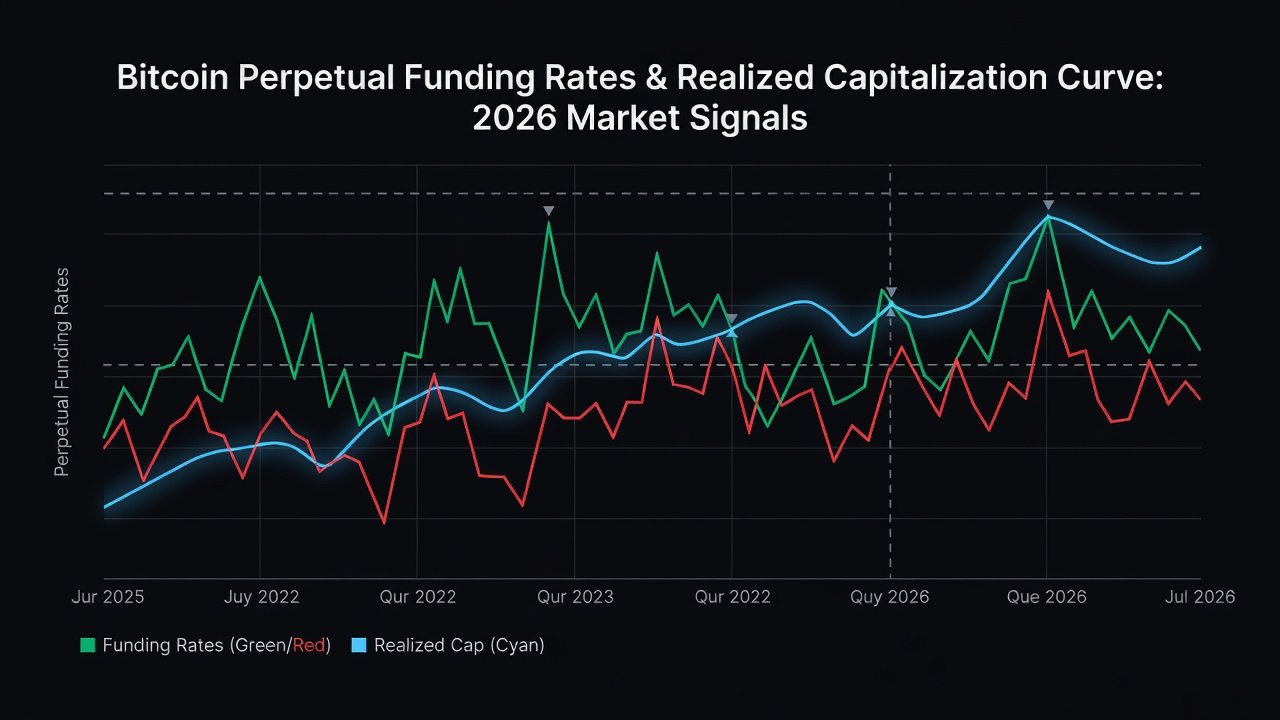
Traders seeking an edge in volatile markets often turn to on-chain data for clearer insights. Combining perpetual futures funding rates with realized capitalization offers a powerful way to spot potential reversals and accumulation phases in Bitcoin during 2026. This approach builds on established funding rate strategies by layering in realized cap analysis, helping refine entry timing beyond single-indicator reliance. As Bitcoin continues its maturation into a mainstream asset class, these metrics become increasingly relevant for both retail and institutional participants navigating macro-driven cycles.
Funding rates reflect the cost of holding long or short positions in perpetual contracts, while realized cap measures the aggregate value of coins at their last moved price. When these metrics diverge from historical norms, they can signal shifts in market sentiment and capital flows that price action alone may obscure. This article explores the mechanics, historical context, and actionable integration strategies tailored for 2026 trading environments.
Core Mechanics of Perpetual Futures Funding Rates
Perpetual futures contracts lack expiration dates, so funding rates keep prices aligned with spot markets through periodic payments between longs and shorts. Positive rates indicate longs pay shorts, often during bullish sentiment when leverage builds aggressively. Negative rates show shorts paying longs, typically in bearish or oversold conditions. High positive rates in over-leveraged conditions frequently precede corrections, as excessive optimism leads to forced liquidations when sentiment shifts.
Understanding these mechanics allows traders to gauge market extremes with precision. For instance, sustained high funding can highlight euphoria phases where new entrants pile in without fundamental support. Conversely, deeply negative rates may reveal capitulation points ripe for accumulation. In 2026, with increased institutional participation, funding rate volatility may intensify around major events like halvings or regulatory announcements, making real-time monitoring essential.
Understanding Realized Capitalization Metrics
Realized cap calculates Bitcoin's market value based on the price at which each coin last transacted on-chain. This differs from traditional market cap by emphasizing holder behavior rather than current spot prices. Rising realized cap during accumulation phases suggests strong hands are entering positions at higher bases, creating firmer support levels over time.
During 2026, monitoring realized cap growth alongside price action can reveal hidden strength in support levels, especially when funding rates remain neutral or mildly negative. A steady increase in realized cap often indicates coins moving from weak to strong hands, reducing sell pressure even if spot prices fluctuate. This metric shines in sideways or recovering markets where traditional indicators lag behind on-chain conviction.
Historical Divergence Patterns from Prior Cycles
Examining past Bitcoin cycles reveals recurring patterns that inform 2026 expectations. In previous bull runs, funding rates spiked positively while realized cap lagged, foreshadowing local tops as leveraged positions unwound. Conversely, negative funding paired with accelerating realized cap often marked accumulation bottoms ahead of rallies, as patient capital absorbed supply from distressed sellers.
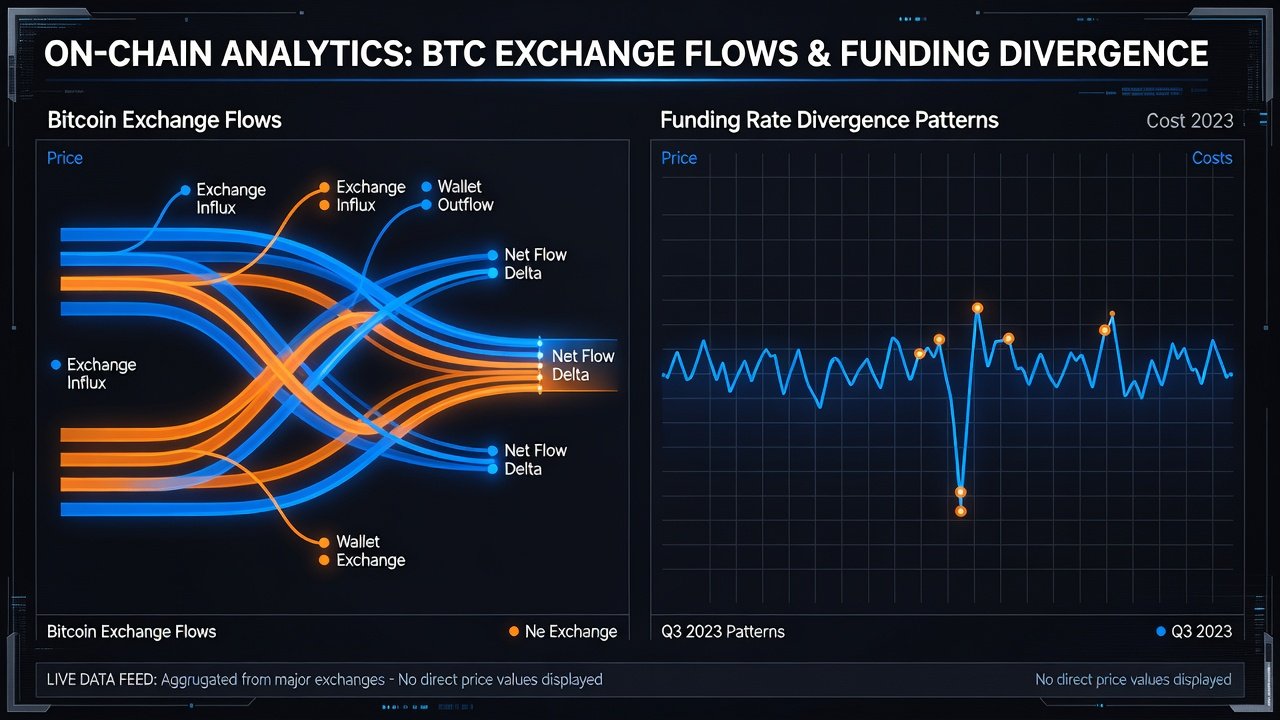
These divergences provide context for 2026 predictions, where similar setups may indicate reversal zones if exchange inflows accelerate. For example, periods of decoupling between spot price momentum and realized cap growth have historically aligned with macro shifts, offering early warnings before broader market moves. Traders who tracked these patterns across multiple cycles gained advantages in timing entries during both euphoric peaks and fear-driven troughs.
Step-by-Step Workflow for Combining Indicators with Exchange Flows
Follow this detailed process to integrate data effectively across platforms:
- Track funding rates via perpetual contract platforms and note extremes above typical thresholds or below negative levels, focusing on 8-hour or daily averages to filter noise.
- Monitor realized cap changes using on-chain dashboards for weekly and monthly trends, paying attention to acceleration or deceleration rates rather than absolute values.
- Cross-reference with exchange net flows to confirm if coins are moving to cold storage (bullish) or onto trading platforms (potentially bearish), using aggregated data from multiple venues.
- Identify divergences, such as rising realized cap amid negative funding and declining exchange inflows, as potential buy signals with higher conviction.
- Set multi-metric alerts for confirmation when flows reverse direction alongside funding normalization, then validate against broader market context like liquidity conditions.
- Review historical analogs from similar setups to assign probability weights before executing trades.
This workflow improves timing by validating signals across multiple layers and reduces reliance on any single data point.
Practical Trader Examples for 2026 Strategies
Consider a scenario where Bitcoin price dips amid macro uncertainty but realized cap climbs steadily while funding rates turn negative. A trader might accumulate positions gradually over several sessions, anticipating a reversal, then scale out when funding normalizes and exchange outflows persist. This layered approach allows for better average entry prices compared to all-in entries.
Another example involves spotting over-leveraged tops: positive funding spikes with flattening realized cap and rising exchange inflows often precede sell-offs. Here, a disciplined trader could reduce exposure or hedge with options, avoiding the common mistake of chasing momentum into exhaustion points. A third case might involve neutral funding combined with accelerating realized cap during consolidation; this setup has historically preceded breakout rallies when paired with improving on-chain velocity metrics.
These examples highlight how confluence across indicators creates higher-probability setups than using funding rates or realized cap in isolation.
Free Tool Setups for Real-Time Alerts
Configure alerts using accessible platforms without incurring costs. Start with on-chain explorers that offer customizable notifications for realized cap shifts and exchange flow changes. Pair them with funding rate trackers from major perpetual exchanges and set threshold-based webhooks that trigger emails or messaging app notifications when conditions align. Many free tiers support basic API access for pulling combined datasets into simple spreadsheets or dashboards for visualization. Test setups during low-volatility periods first to refine alert frequency and avoid notification fatigue during high-activity windows.
Short FAQ on Avoiding False Signals in High-Volatility Periods
How do I filter noise during volatility spikes?
Focus on multi-day averages rather than hourly readings to smooth out temporary distortions in both funding and realized cap data, and always require confirmation from exchange flow trends.
What confirms a true reversal signal?
Look for alignment across funding rates, realized cap trends, and exchange flows over at least 48 hours before acting, supplemented by volume profile analysis where available.
Are there common pitfalls with these metrics?
Over-reliance on one indicator during news events can lead to false positives; always require confluence from at least two metrics and maintain strict position sizing rules.
How should traders handle conflicting signals?
When funding and realized cap disagree, defer to exchange flow direction as the tiebreaker and wait for resolution rather than forcing trades on incomplete data.
What role does market regime play in signal reliability?
In high-volatility regimes, extend confirmation windows and reduce position sizes; in calmer periods, signals tend to resolve faster with fewer whipsaws.
Conclusion
Integrating funding rates with realized cap equips traders with robust 2026 strategies for better-timed entries. By studying historical patterns, implementing structured workflows, and leveraging free alert tools, market participants can navigate Bitcoin's cycles more effectively while managing downside risks. Explore resources from Glassnode, Bitcoin.org, and Coinmetrics to deepen your analysis and stay ahead of evolving on-chain dynamics.

No comments yet. Be the first!