 CryptoChain Blog
Introduction to Funding Rates and On-Chain Metrics for BTC Reversals
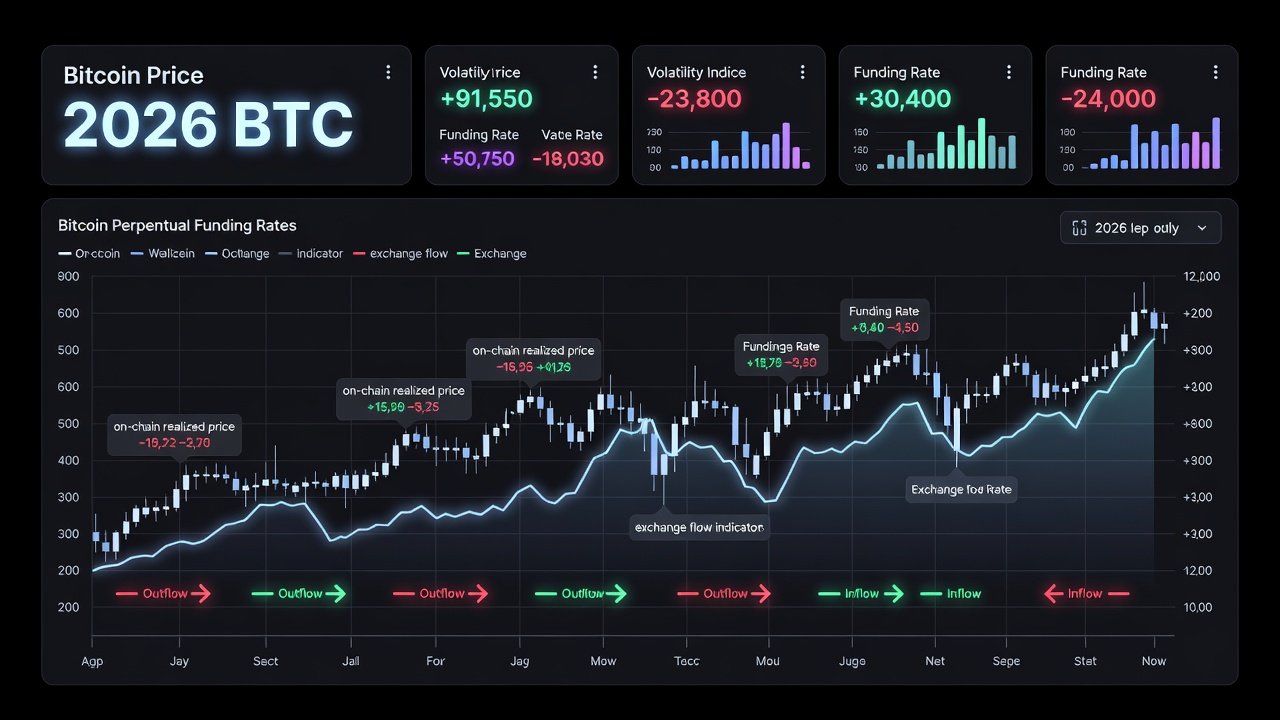
Bitcoin traders in 2026 face increasingly complex market dynamics where traditional technical analysis alone falls short. Pairing perpetual futures funding rates with on-chain indicators such as realized price and exchange flows provides a powerful framework for identifying potential reversals. This fusion helps distinguish between temporary corrections and structural shifts in market sentiment. Funding rates act as a real-time gauge of leverage bias in derivatives markets, while on-chain metrics reveal the underlying holder behavior and capital movement across the blockchain.
In practice, this approach allows traders to anticipate moves before they appear on price charts alone. For instance, when funding rates remain stubbornly positive yet exchange flows turn negative and realized price begins to flatten, it often signals weakening conviction among leveraged longs. The 2026 landscape, shaped by greater institutional involvement and regulatory clarity in major jurisdictions, makes these combined signals even more potent because they filter out retail-driven noise.
Understanding the Mechanics of Divergences
Divergences occur when funding rates and on-chain metrics move in opposite directions. A classic bullish divergence forms when funding rates turn negative while realized price holds steady and exchange outflows increase. This setup historically preceded strong rebounds in prior cycles because it shows that despite bearish derivatives sentiment, actual coin holders are not capitulating. Conversely, bearish divergences appear when funding stays elevated despite declining realized price and accelerating exchange inflows. Traders monitor these mismatches closely because they often precede volatility spikes. In 2026 conditions, with maturing derivatives markets, these signals have become more reliable when confirmed by open interest trends and multi-exchange data aggregation.
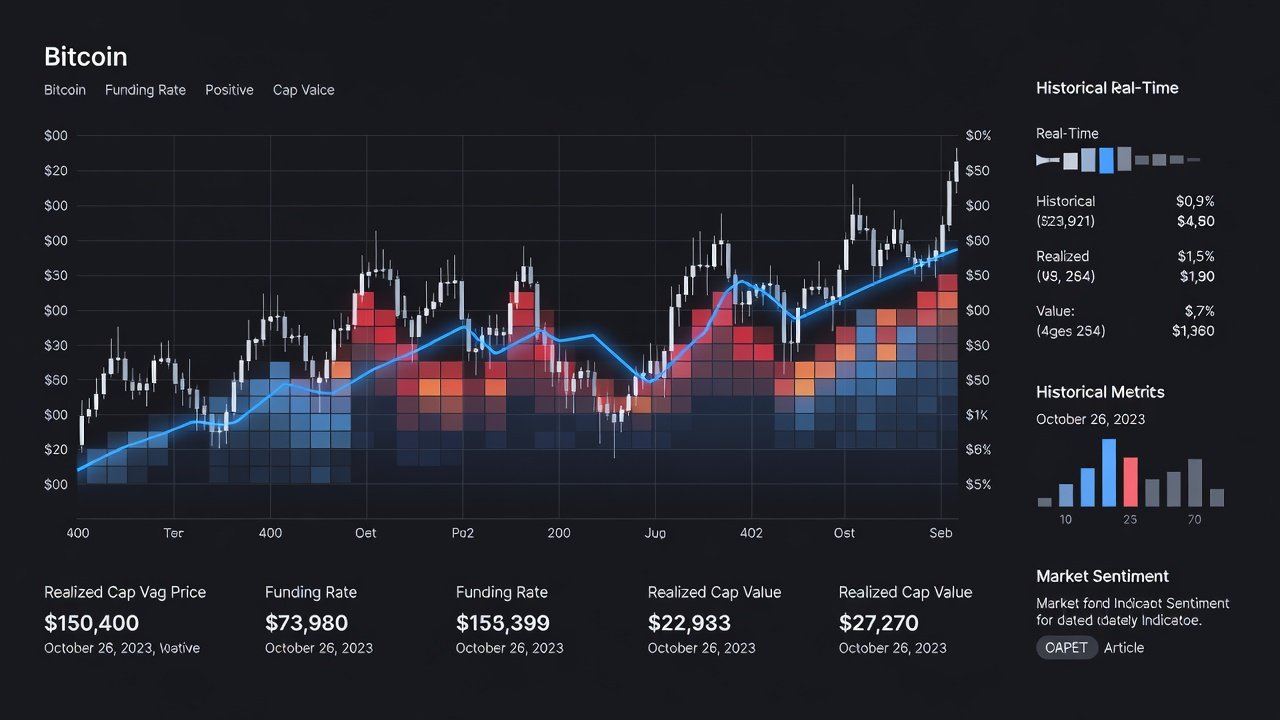
Additional nuance comes from examining the duration and magnitude of the divergence. Short-lived flips lasting only a few hours frequently reverse without follow-through, whereas divergences persisting across multiple sessions tend to produce larger price swings. Realized price serves as a critical anchor because it represents the aggregate cost basis of circulating supply, creating natural zones of support and resistance that derivatives traders often overlook.
Real-Time Monitoring Setups Using Coinglass and Glassnode
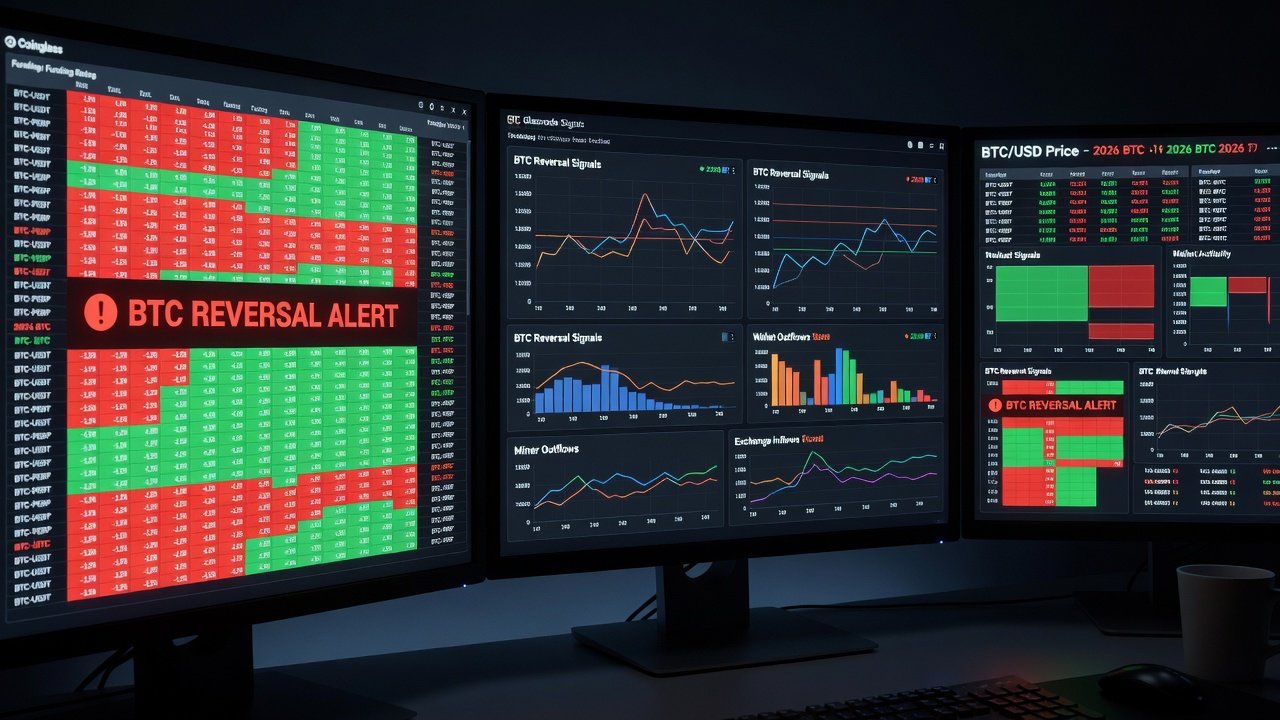
Effective monitoring starts with Coinglass for funding rate heatmaps and perpetual contract data across major exchanges. Set custom dashboards to track BTC perpetuals on Binance, Bybit, and OKX simultaneously. Overlay open interest changes to spot leverage buildups that may precede forced liquidations. Advanced users can export historical funding series for backtesting against on-chain events from the same periods.
Complement this with Glassnode for on-chain metrics. Key indicators include realized price, exchange net flows, active address counts, and spent output profit ratio. Create alerts for when 30-day moving averages of exchange inflows exceed historical thresholds while funding rates remain positive. Many traders integrate both platforms through API connections or third-party dashboards to receive unified notifications. This setup reduces reaction time during fast-moving reversals and helps maintain discipline by automating the first layer of signal detection.
2021-2025 Case Studies Adapted for 2026 Conditions
Reviewing past cycles reveals repeatable patterns. In early 2021, negative funding paired with strong exchange outflows marked the March reversal, allowing early entrants to capture substantial upside. Similar setups in 2022 during the FTX aftermath and again in 2024 around the halving period showed how realized price acted as dynamic support during capitulation phases. Each instance featured prolonged negative funding accompanied by declining active exchange balances.
For 2026, adapt these lessons to a market with higher institutional participation and tighter derivatives regulations. Focus on divergences lasting longer than 48 hours and confirmed by at least two on-chain metrics. Adjust thresholds upward because overall market capitalization has grown substantially, meaning absolute flow numbers now carry different weight. Institutional custody solutions also mean fewer coins appear on visible exchange wallets, so traders must incorporate adjusted metrics that account for off-exchange movements when possible.
Step-by-Step Alert Workflows
- Configure Coinglass alerts for funding rate crossing zero with 4-hour persistence across at least three major exchanges.
- Link Glassnode webhooks to notify when exchange flows deviate more than two standard deviations from the 90-day mean.
- Cross-reference with open interest delta; a 15% drop in OI during negative funding strengthens reversal probability significantly.
- Validate with realized price proximity; entries near or below realized price increase conviction and improve risk-reward ratios.
- Log each alert in a trading journal with screenshots of both platforms to review accuracy over time and refine thresholds.
Open Interest Integration Examples
Open interest serves as the bridge between funding and on-chain data. Rising OI with positive funding often indicates leveraged long buildup vulnerable to squeezes. In one 2025 example, OI expansion during a funding spike coincided with heavy exchange inflows, correctly forecasting a 12% pullback within days. Traders should watch for OI contraction alongside improving on-chain fundamentals as a green light for reversal longs. This combination reduces false signals common in isolated funding analysis. In 2026, pay special attention to OI on regulated platforms because their data tends to reflect more stable capital rather than speculative retail flows.
Practical Reversal Entry and Exit Rules
- Enter long when funding turns negative, exchange flows flip to outflows, and price tests realized price support within a 2% band.
- Place stops below the recent swing low or 5% under realized price, whichever provides tighter risk control.
- Target exits when funding normalizes to near zero and on-chain accumulation slows for multiple consecutive days.
- Scale out in thirds: 30% at first resistance, 40% at prior high, remainder on momentum fade or new divergence formation.
- Incorporate position sizing rules that limit total exposure to 2-3% of portfolio per setup to survive sequences of false signals.
Free Versus Premium Data Sources Comparison
Free tiers on Coinglass and Glassnode provide solid basic funding and flow data sufficient for most retail setups and daily decision making. Premium subscriptions unlock advanced metrics like entity-adjusted flows, real-time API access, and historical depth that become valuable for high-frequency monitoring in 2026. Free options work well for daily timeframe analysis, while premium tools excel during fast-moving events or when building automated systems. Many traders start with free versions and upgrade only after validating strategy performance over several months of live trading. Additional free resources such as exchange-provided open interest feeds can supplement the core platforms without extra cost.
FAQ on Common Pitfalls
How do I avoid false divergences during low-volume periods?
Filter signals by requiring minimum open interest thresholds and confirmation from at least two exchanges. Low liquidity environments often produce noisy funding data that fails to translate into sustained price moves.
Should I trade every funding flip?
No. Only act on flips backed by on-chain confirmation and realized price context. Isolated funding changes frequently fail in ranging markets and lead to unnecessary transaction costs.
What timeframes work best in 2026?
4-hour to daily charts provide the cleanest signals. Intraday noise has increased with retail participation, so higher timeframes reduce whipsaws and improve overall win rate.
How important is multi-exchange aggregation?
Very important. Single-exchange anomalies can mislead; always verify funding and flow data across Binance, Bybit, and at least one additional venue before committing capital.
Can these strategies work in bear markets?
Yes, but adjust expectations. Reversals in bear markets tend to be shorter in duration, so tighter profit targets and faster exits become necessary to capture gains before new lows form.
Conclusion
Integrating funding rates with on-chain metrics creates a robust reversal detection system tailored for 2026 Bitcoin markets. By mastering Coinglass and Glassnode workflows, applying historical lessons, and following disciplined entry rules, traders gain a measurable edge. Consistent practice with alert setups and open interest overlays turns these concepts into actionable strategies that stand the test of evolving market conditions and help navigate both bull and bear phases with greater confidence.
No comments yet. Be the first!