 CryptoChain Blog
Introduction to Bitcoin Funding Rates and Open Interest
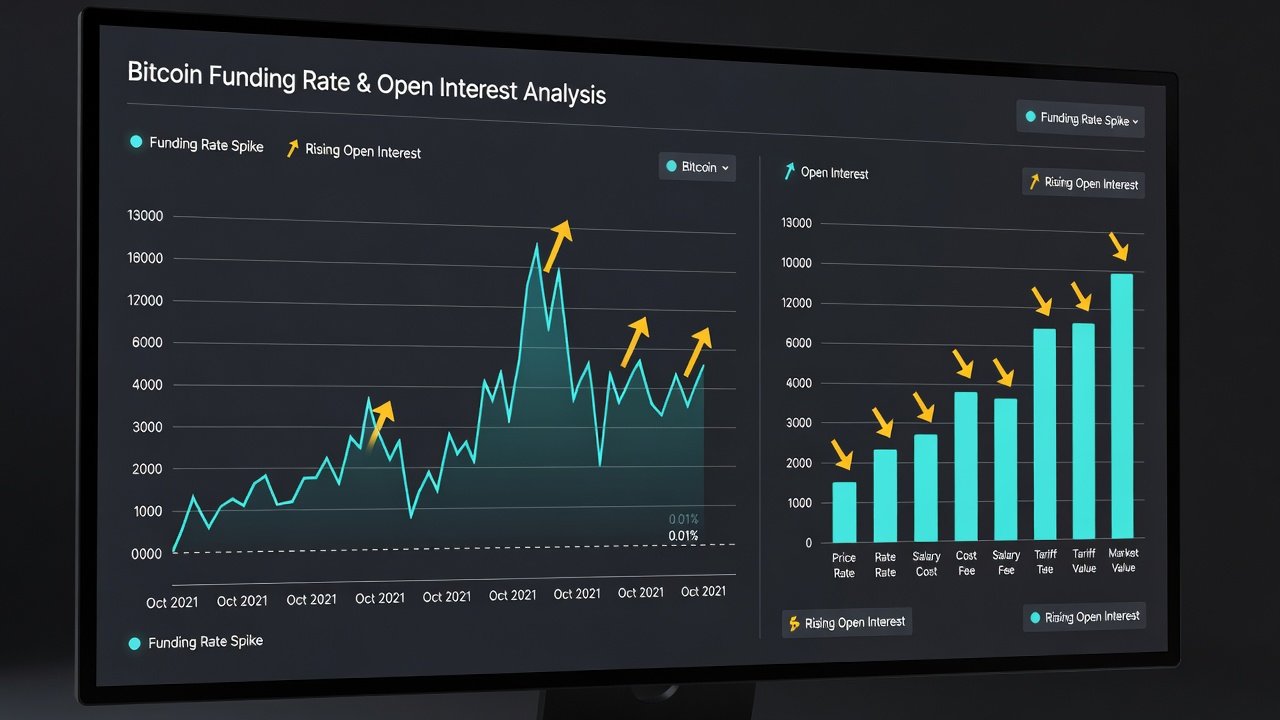
Bitcoin perpetual futures dominate crypto trading volume, and traders rely on funding rates alongside open interest to anticipate reversals. In 2026, pairing these metrics creates stronger signals than either alone. Funding rates reflect the cost of holding long or short positions, while open interest tracks the total number of outstanding contracts. When funding rates spike to extremes and open interest confirms the move, reversals often follow with higher probability. This approach helps filter out noise in volatile markets where single-metric strategies frequently fail. Understanding the interplay between these indicators allows traders to build more robust reversal playbooks tailored to evolving market dynamics throughout 2026.
This playbook covers the core mechanics, confirmation rules, historical examples from 2024-2025, free monitoring tools, and practical workflows for 2026 market conditions. It also includes integration with trading volume, alert configurations, checklists, and answers to common questions about high-volatility periods.
Mechanics of Funding Rate Extremes
Funding rates in perpetual contracts are periodic payments exchanged between long and short traders. Positive rates mean longs pay shorts, typically signaling bullish sentiment. Negative rates indicate the opposite. Extreme positive rates above 0.05% per 8-hour period on major exchanges often precede local tops, while deeply negative rates below -0.05% can mark bottoms. These thresholds vary by volatility regime but have historically aligned with reversal points. The calculation itself is based on the premium or discount of the perpetual contract relative to the spot price, adjusted every eight hours on most platforms. During periods of strong directional momentum, rates can remain elevated for multiple intervals, building pressure that eventually leads to liquidations or profit-taking.
Extreme rates alone do not guarantee reversals. They must be validated by shifts in trader positioning captured through open interest. Without this confirmation, traders risk entering positions too early or misreading temporary imbalances as structural shifts.
How Open Interest Confirms or Invalidates Reversals
Open interest rises when new contracts are opened and falls when positions are closed. Rising open interest during a funding rate spike strengthens the signal of crowded positioning. For example, surging positive funding rates paired with climbing open interest suggest new longs are entering aggressively, increasing reversal risk once sentiment shifts. Conversely, if open interest begins to decline while funding rates stay extreme, it often means traders are reducing exposure rather than adding to it, weakening the reversal thesis.
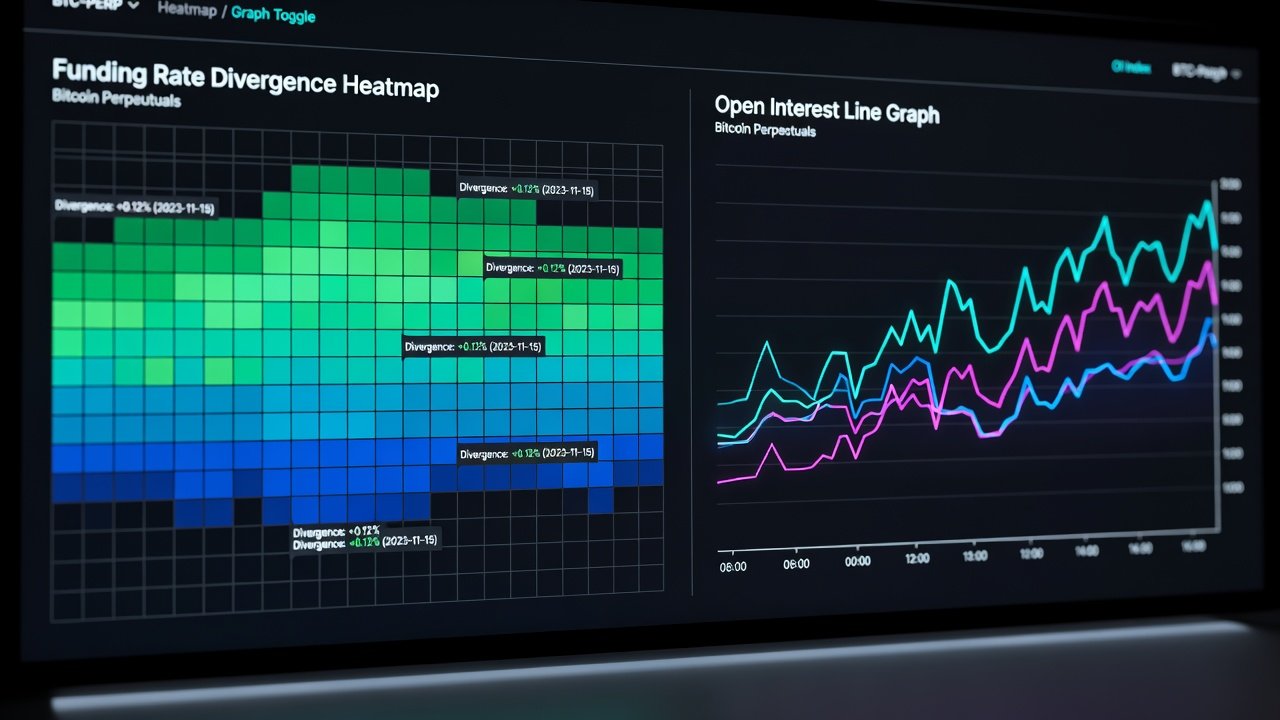
Falling open interest during extreme funding rates often invalidates the signal. It indicates existing positions are being closed rather than new ones added, reducing the likelihood of a sharp reversal. Traders watch for divergences where funding rates reach extremes but open interest plateaus or declines. In practice, this divergence appears in charts as a funding rate line peaking while the open interest line flattens or drops, providing a clear visual cue to stand aside.
2024-2025 Historical Case Studies
In March 2024, Bitcoin funding rates on major platforms reached multi-month highs above 0.08% while open interest climbed steadily to record levels. The subsequent correction exceeded 15% within two weeks as leveraged longs unwound positions. A similar pattern emerged in December 2024 when negative funding rates hit -0.06% amid declining open interest, leading to a short squeeze rather than a sustained bottom. Mid-2025 brought additional examples where repeated funding spikes without open interest growth produced multiple false reversal signals, teaching traders the importance of waiting for both metrics to align.
These cases underscore the value of requiring both metrics to align before acting. Another notable instance occurred in September 2025 when positive funding rates climbed alongside rising open interest during a macro-driven rally; the reversal that followed was sharp but short-lived because volume failed to confirm the move, highlighting the need for multi-metric analysis.
Real-Time Monitoring Workflows Using Free Dashboards
Free platforms provide live funding rate and open interest data across exchanges. Coinglass aggregates perpetual futures metrics with heatmaps highlighting extreme rates. TradingView offers customizable charts overlaying open interest with price action. Binance and Bybit publish their own funding rate histories for direct comparison.
Set up a workflow by monitoring the Bitcoin perpetual pair on Coinglass for rate extremes, then cross-reference open interest trends on TradingView. Refresh data every four hours during high-volatility sessions and maintain a log of threshold breaches to identify patterns over time. Advanced users can combine these dashboards with simple browser extensions that notify when multiple exchanges show synchronized extremes.
Integration with Perpetual Futures Volume
Volume provides additional context. High volume accompanying a funding rate spike and rising open interest confirms strong conviction. Low volume during the same conditions suggests weak participation and higher chance of reversal failure. Combine all three metrics—funding rates, open interest, and volume—for the most robust signals in 2026. Volume spikes often precede or coincide with the moment open interest begins to roll over, offering an early warning that the crowded trade is losing steam.
Step-by-Step Alert Setups
- Configure Coinglass alerts for Bitcoin funding rates crossing ±0.05% thresholds on at least two major exchanges.
- Add TradingView alerts on open interest changes exceeding 5% within a 24-hour window, using the built-in pine script indicators for perpetual futures data.
- Cross-check volume spikes using exchange APIs or dashboard notifications to ensure participation supports the move.
- Log signals in a simple spreadsheet noting date, rate level, open interest direction, volume confirmation, and prevailing market narrative.
- Review alerts daily and adjust thresholds based on prevailing volatility measured by average true range or funding rate standard deviation.
Practical Trader Checklists
- Confirm funding rate extreme on at least two exchanges to rule out platform-specific anomalies.
- Verify open interest trend direction matches or diverges appropriately from the funding rate signal.
- Check volume for conviction support and ensure it exceeds the 20-day average.
- Assess broader market context including macroeconomic events, ETF flows, and regulatory news.
- Define risk parameters including stop-loss levels and position sizing before entering any reversal trade.
- Document the trade rationale and review outcomes after each signal to refine future decision-making.
Common Pitfalls to Avoid
Many traders act on funding rate extremes without open interest confirmation, leading to premature entries. Others ignore exchange-specific differences in funding calculations or settlement times. During high-volatility periods, rates can remain extreme longer than expected, requiring patience and multiple confirmations. Another frequent mistake is neglecting weekend gaps when liquidity thins and open interest can shift rapidly without corresponding price movement. Traders should also avoid over-reliance on a single dashboard and instead cross-verify data across sources to prevent API or display errors from triggering false alerts.
FAQ on Interpreting Divergences in High-Volatility Periods
How reliable are funding rate divergences when volatility spikes?
Divergences gain reliability when open interest also diverges. In high-volatility environments, wait for at least two consecutive funding periods to confirm persistence before acting on the signal.
Should traders use multiple timeframes for open interest?
Yes. Daily open interest trends provide the primary signal, while 4-hour views help time entries around funding settlements and reduce the impact of short-term noise.
What happens if volume contradicts the other metrics?
Contradictory volume often signals false moves. Defer trading until volume aligns with the funding rate and open interest setup to avoid whipsaw losses.
Can funding rate extremes persist for extended periods in 2026?
Yes, especially during strong trending markets driven by institutional flows. In such cases, open interest growth becomes the decisive factor that determines whether a reversal is likely or if the trend will continue.
Conclusion
Combining Bitcoin funding rates with open interest delivers a tactical edge for 2026 reversal trading. By following the mechanics, historical lessons, monitoring workflows, and checklists outlined above, traders can filter noise and focus on high-probability setups. Consistent application of these principles supports disciplined decision-making in dynamic market conditions and helps navigate the complexities of perpetual futures markets throughout the year.
No comments yet. Be the first!