 CryptoChain Blog
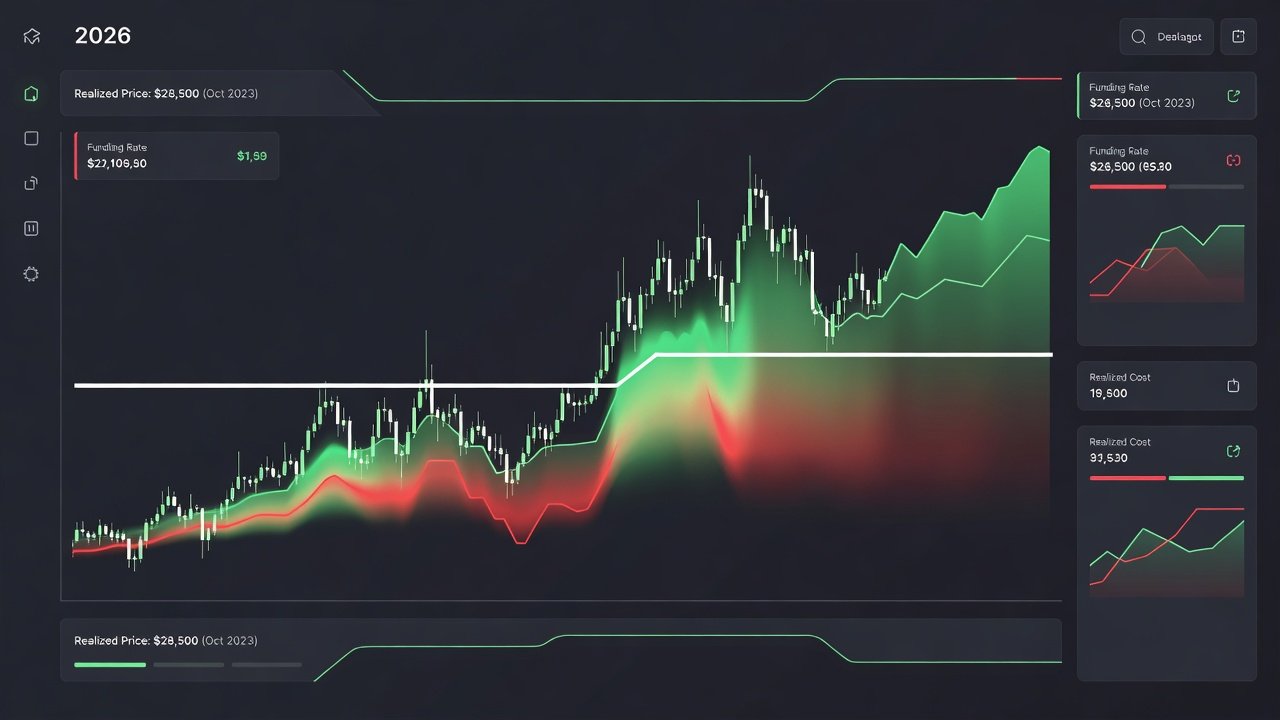
Introduction to Bitcoin Funding Rates and Realized Price Signals
Traders in 2026 increasingly combine perpetual futures funding rates with Bitcoin's realized price to identify high-probability reversal zones. This approach moves beyond single-metric analysis by layering derivatives sentiment data with on-chain cost basis levels. The result is a more robust framework for spotting when leveraged positions become overcrowded relative to actual holder behavior. In volatile markets, relying on isolated indicators often leads to false signals, but the synergy between funding rates and realized price provides clearer context for both short-term swings and longer-term trend shifts.
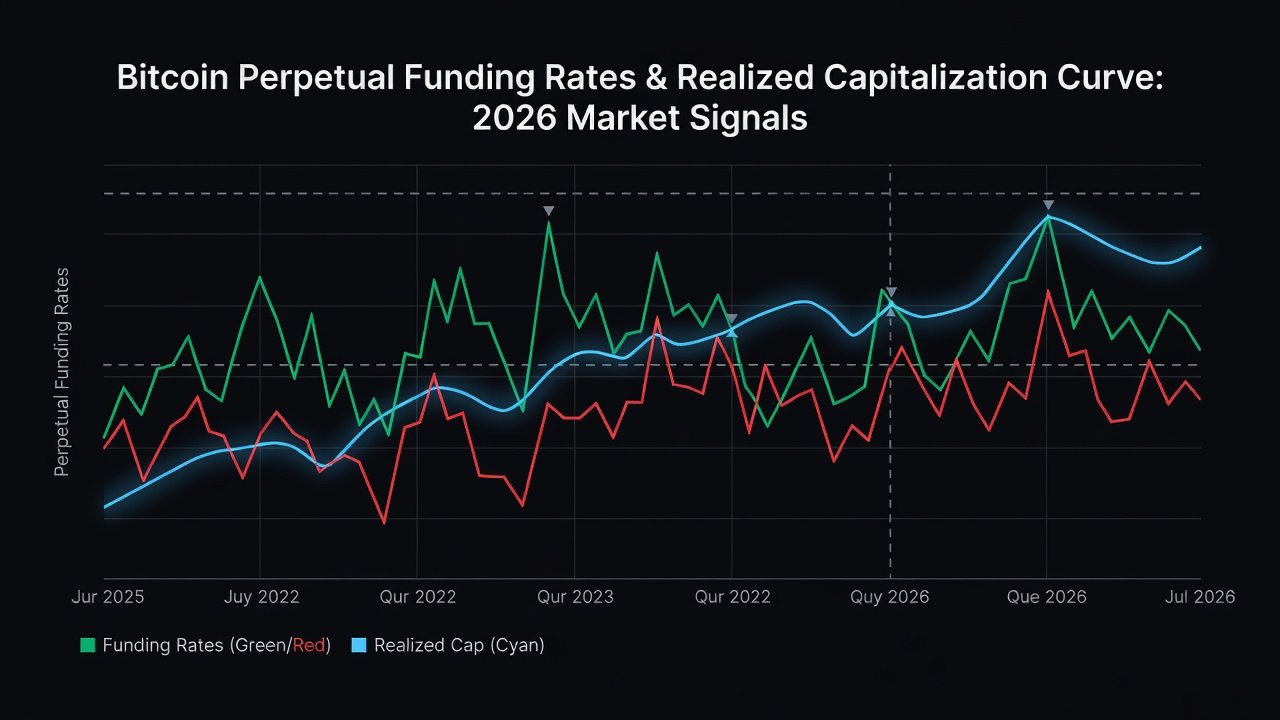
Funding rates measure the cost of holding long or short positions in perpetual contracts. When rates turn sharply positive or negative near realized price thresholds, they often precede meaningful price swings. Realized price, calculated as the average acquisition cost across all coins, acts as a dynamic support or resistance anchor. This combination has gained traction among professional traders seeking an edge in 2026's maturing derivatives landscape.
Understanding Realized Price Calculation
Realized price differs from spot price by reflecting the volume-weighted average price at which coins last moved on-chain. It serves as a proxy for the collective cost basis of Bitcoin holders. When spot price approaches this level, many participants face break-even conditions, increasing sensitivity to funding rate extremes. Traders can track daily changes in realized price to gauge whether the market is in profit or loss territory overall.
Mechanics of Funding Rate Deviations Relative to Realized Price Zones
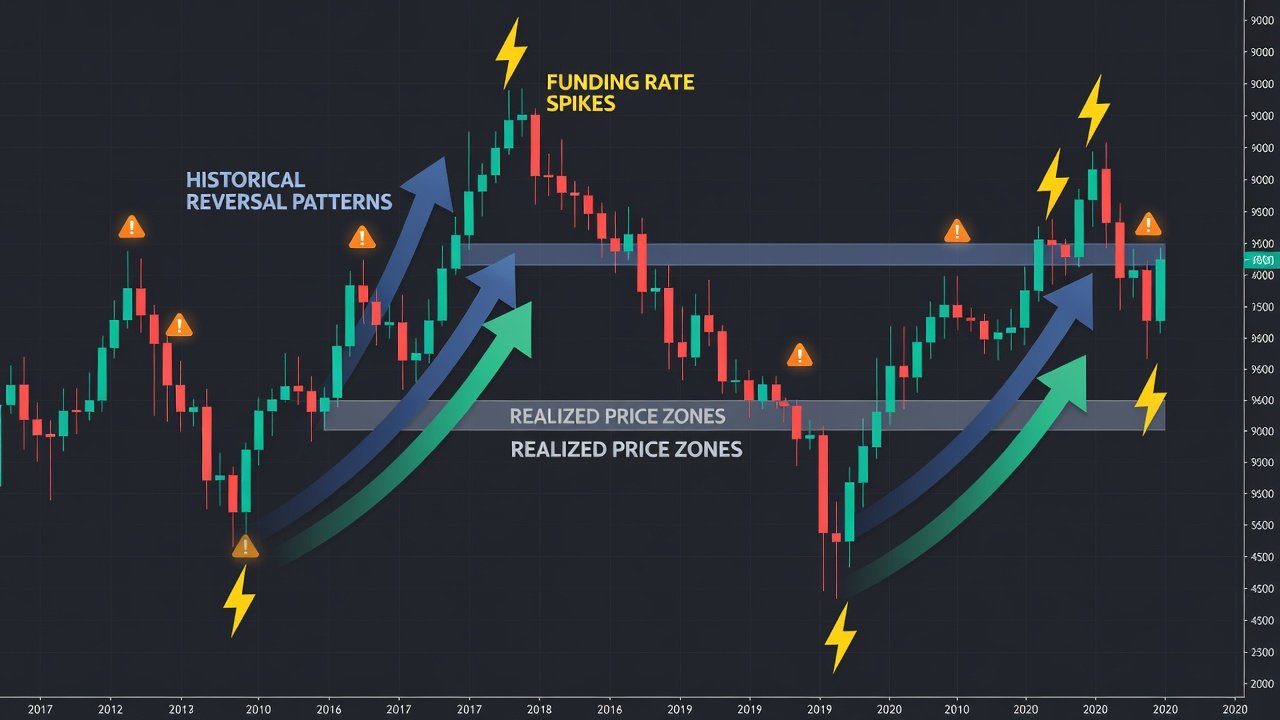
Funding rates oscillate around zero based on market skew. Extreme positive rates indicate long dominance, while deep negative rates signal short crowding. When these extremes coincide with Bitcoin trading near its realized price, the probability of mean reversion rises because both leveraged traders and spot holders face pressure simultaneously. Deviations are measured by comparing the current funding rate to its 30-day average. A rate exceeding two standard deviations above the mean while price sits within 5% of realized price creates a classic over-leveraged long setup. Conversely, sharply negative funding near realized price can mark capitulation bottoms. For example, a funding rate of +0.05% during periods when realized price acts as resistance often signals impending liquidations on the long side.
Historical Reversal Patterns from Recent Cycles
Analysis of prior cycles shows recurring patterns. In late 2024 and early 2025, funding rates spiked above 0.05% per 8-hour period while Bitcoin hovered near realized price; each instance preceded 15-25% corrections within two weeks. Negative funding clusters below -0.03% near the same zone aligned with local bottoms followed by strong rebounds. These patterns strengthen when exchange inflows accelerate alongside funding extremes, confirming distribution or accumulation by large holders. Similar behavior appeared in mid-2023 cycles, where funding deviations near realized price accurately flagged both the March rally top and the October low.
Integrating Exchange Inflow Data for Confirmation
Exchange inflow spikes often validate funding signals. Large transfers to exchanges near realized price with elevated funding suggest profit-taking pressure. Traders monitor 24-hour inflow volumes alongside funding deviations to filter false signals. This multi-factor confluence reduces noise from isolated funding spikes. Combining these elements creates a layered confirmation system that has proven reliable across multiple market regimes.
Coinglass provides real-time funding rate dashboards across major exchanges, while Glassnode offers realized price and exchange flow metrics for deeper context. Additional insights are available at Bitcoin.org.
Tools and Data Sources for Effective Monitoring
Selecting the right platforms is essential for real-time execution. Professional traders often integrate multiple APIs to cross-verify funding rates from Binance, Bybit, and OKX. On-chain providers deliver realized price updates with varying lag times, so choosing sources with sub-hourly resolution improves accuracy. Custom dashboards built with Python or no-code tools like Zapier can automate data pulls and alert generation.
Step-by-Step Workflow for Setting Real-Time Alerts
- Connect to a data platform that streams both funding rates and realized price, ensuring API keys are configured for multiple exchanges.
- Define deviation thresholds: funding rate > +0.04% or < -0.025% combined with price within 3% of realized price, and test these levels against historical data.
- Add exchange inflow filters above a 30-day average to require confirmation from on-chain activity.
- Route alerts to Telegram or email for immediate notification, including key metrics in the message body.
- Backtest the rule set on at least two prior market cycles before live deployment, adjusting for slippage and latency.
- Review and refine thresholds monthly as market conditions evolve.
Practical Case Studies
Case 1: March 2025 rally saw funding rates reach +0.06% as price touched realized price. Inflows rose 40% above average, triggering short alerts. Bitcoin corrected 18% over the following ten days, validating the combined signal.
Case 2: October 2025 low formed when funding dipped to -0.04% near realized price with moderate inflows. Long entries aligned with the subsequent 30% advance over six weeks.
Case 3: January 2026 sideways market produced a funding spike to +0.045% exactly at realized price with rising exchange deposits. Traders who waited for inflow confirmation avoided a brief 8% pullback.
Comparisons Against Standalone Indicators
Standalone funding rates produce frequent whipsaws during low-volatility periods. Realized price alone misses leverage dynamics and can lag during rapid moves. The combined model improves signal accuracy by requiring agreement from both derivatives and on-chain layers, outperforming either metric in isolation during 2024-2025 backtests. Adding volume or volatility filters further enhances performance.
Advanced Integration Techniques
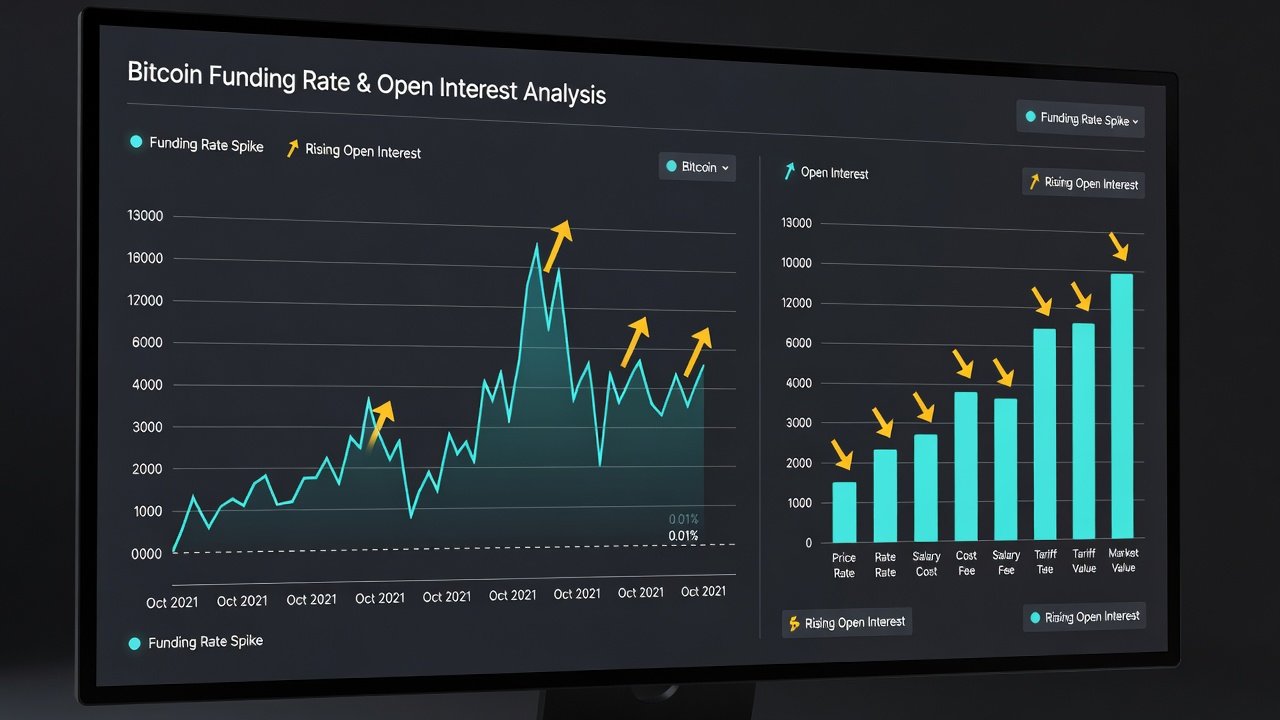
Seasoned analysts layer additional metrics such as open interest changes and perpetual volume ratios. For instance, rising open interest alongside positive funding near realized price increases the likelihood of a long squeeze. Machine learning models can weight these factors dynamically based on recent regime shifts.
Risk Management Tactics and Common Pitfalls
Position sizing should remain conservative when signals align, limiting exposure to 1-2% of capital per trade. Use stop-losses beyond recent swing highs or lows to account for volatility. Avoid trading during major news events that can override technical signals. Diversify across timeframes and maintain a trading journal to track signal performance.
Common pitfalls include ignoring exchange-specific funding differences, failing to account for lag in realized price updates, and over-leveraging on the first alert without confirmation. Always verify data across multiple platforms before execution. Another frequent mistake is neglecting weekend gaps or low-liquidity periods that amplify funding volatility.
Conclusion
Pairing Bitcoin funding rates with realized price delivers a powerful, multi-dimensional signal for 2026 trading. By following structured workflows, confirming with inflows, and applying disciplined risk rules, traders can improve decision quality while avoiding common traps. Continuous backtesting and adaptation remain key to long-term success.
FAQ
What tools are best for monitoring funding rates?
Platforms such as Coinglass and exchange-native APIs deliver the most reliable real-time funding data, often combined with on-chain providers for realized price.
How do I interpret mixed signals between funding and realized price?
Wait for confluence with secondary metrics like exchange flows before acting. Isolated signals carry higher false-positive risk and should be treated cautiously.
Can this approach work in bear markets?
Yes, negative funding extremes near realized price have historically marked durable bottoms even during prolonged downtrends, though confirmation from inflows is essential.
How often should thresholds be recalibrated?
Review thresholds monthly or after major market regime changes to maintain relevance as volatility and liquidity evolve.
Is backtesting sufficient for live trading?
Backtesting provides a foundation, but forward-testing on small size and paper trading for several weeks is recommended before scaling up.
No comments yet. Be the first!