 CryptoChain Blog
Introduction to Bitcoin Realized Price Divergences
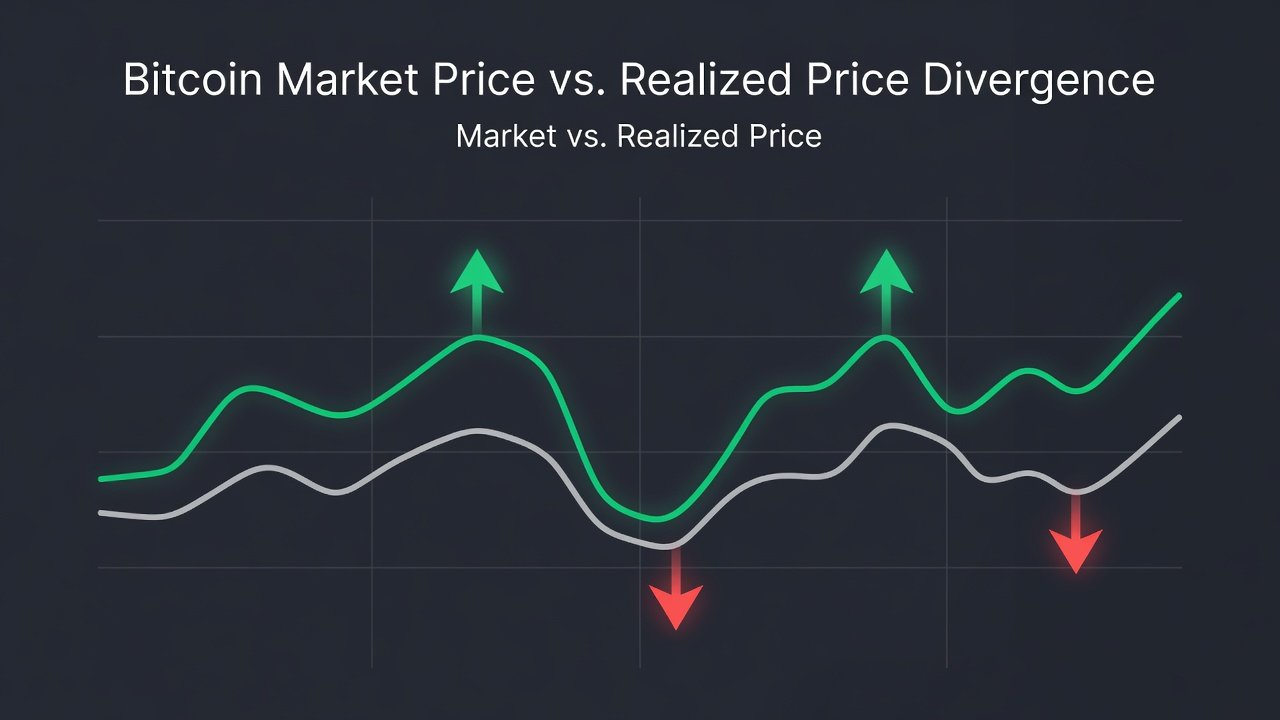
Bitcoin realized price represents the average cost basis of all coins in circulation, calculated by weighting each UTXO by its last movement price. When this metric diverges significantly from the current market price, it often signals potential reversal points or high-conviction entry opportunities. In 2026, traders are increasingly using these divergences to time spot and futures positions with greater precision. This approach moves beyond traditional technical analysis by incorporating on-chain fundamentals that reflect actual holder behavior rather than sentiment alone.
Understanding these signals requires moving beyond simple price charts into on-chain data. Realized price acts as a dynamic support or resistance level, reflecting the aggregate entry points of long-term holders. Divergences create actionable setups because they highlight when market participants are either underwater on their positions or sitting on substantial unrealized gains that could trigger selling pressure.
Calculating Realized Price and Spot Divergences
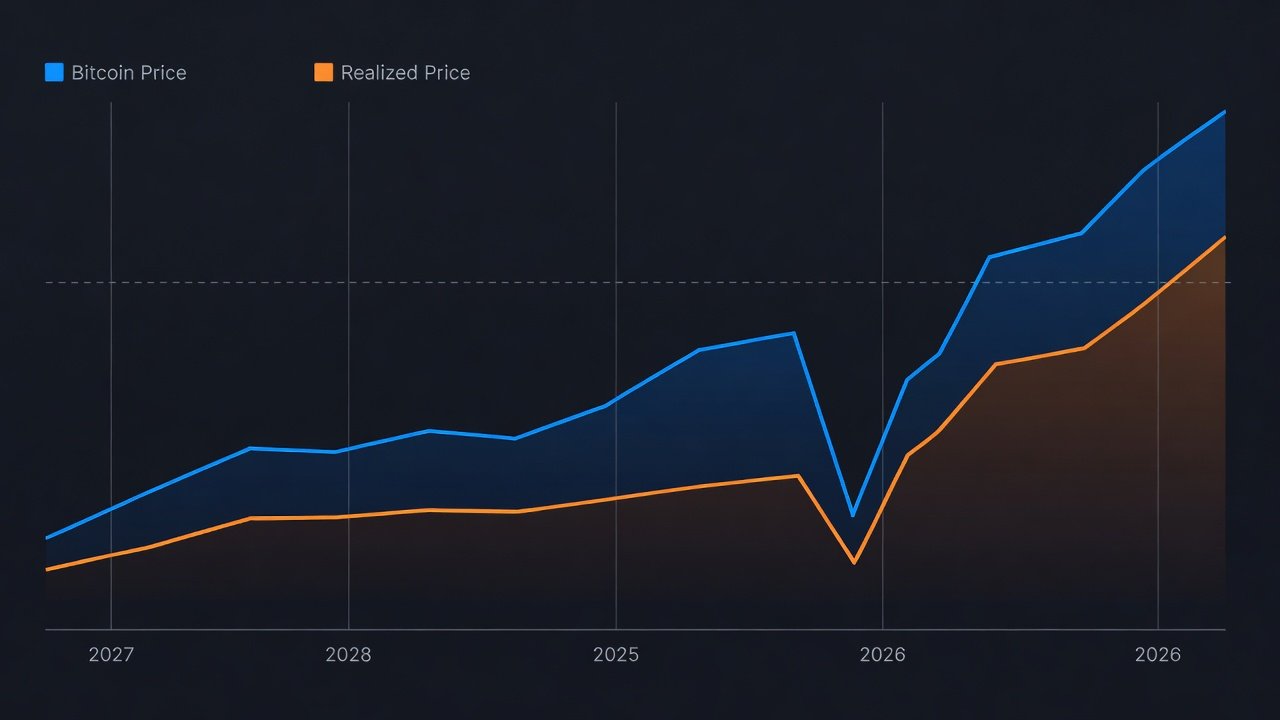
The realized price is derived from the realized capitalization divided by the circulating supply. Divergences occur when the market price trades well above or below this realized baseline. Bullish divergences typically form when price holds above realized price during corrections, indicating strong holder conviction. To calculate manually, aggregate the value of all UTXOs at their creation prices and divide by total supply. Most traders rely on dashboards for real-time computation, but grasping the formula helps interpret anomalies correctly.
Advanced calculation involves segmenting by holder cohorts, such as short-term versus long-term holders. This reveals whether recent buyers or veterans are driving the divergence. Free tools automate this process, yet manual verification of key levels builds deeper intuition for interpreting sudden shifts in 2026 market conditions.
Historical Reversal Patterns in Bitcoin
Over multiple cycles, realized price divergences have preceded major reversals. For instance, when price dipped below realized price in bear markets, recoveries often followed as accumulation zones formed. In prior bull runs, sustained premiums above realized price marked euphoria phases ripe for profit-taking. These patterns repeat because they capture shifts in holder behavior rather than short-term noise. 2026 setups are likely to mirror 2020-2021 dynamics but with added institutional flows.
Additional historical context shows that extreme divergences in 2018 and 2022 both aligned with capitulation events where long-term holders accumulated aggressively. Traders who tracked the narrowing of these gaps captured the subsequent multi-month rallies. Understanding the duration and magnitude of past divergences helps set realistic expectations for how long 2026 signals may take to resolve.
Integrating SOPR and MVRV Ratios
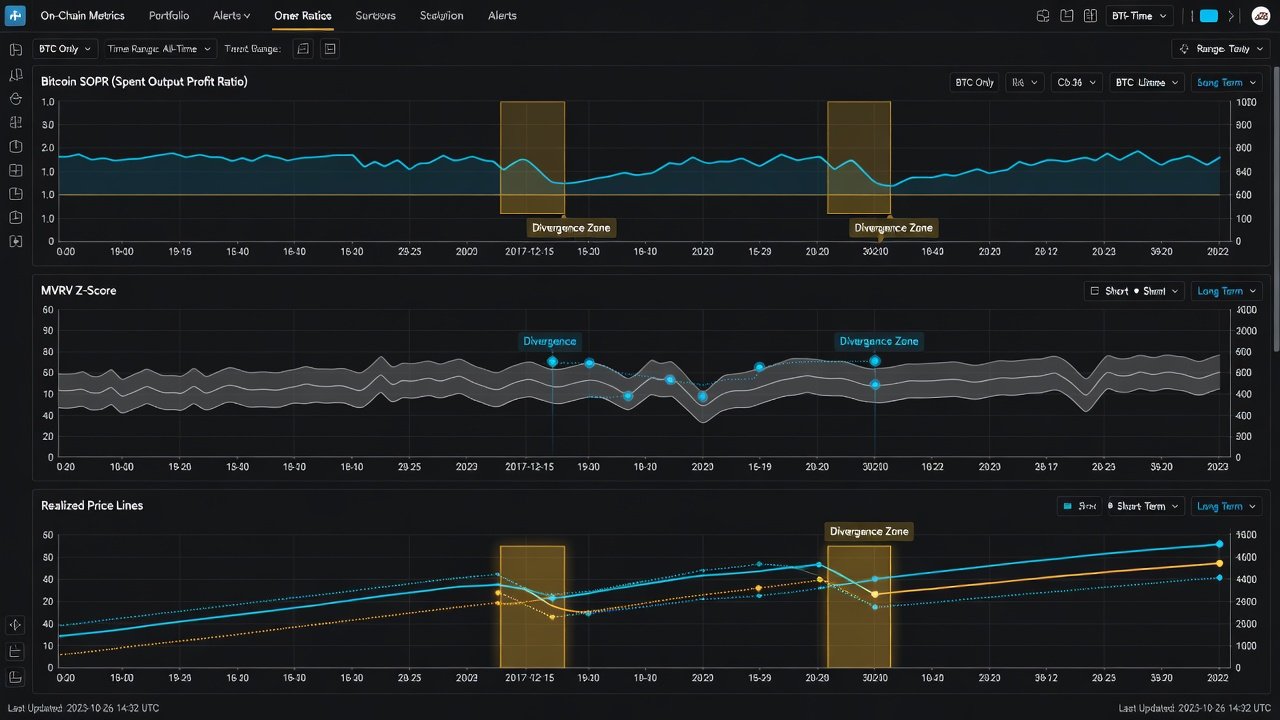
The Spent Output Profit Ratio (SOPR) measures whether coins are being sold at a profit or loss. When combined with realized price divergences, SOPR below 1 during a premium to realized price often confirms capitulation bottoms. MVRV Z-Score further refines this by comparing market value to realized value. High MVRV readings alongside narrowing divergences warn of overvaluation, while low readings during divergences highlight undervaluation. Traders monitor these together for confluence.
Additional integration involves watching for SOPR spikes that coincide with price reclaiming realized price, which often marks the start of sustainable uptrends. MVRV bands can be layered to identify overbought conditions even when price remains close to realized levels. This multi-metric view reduces false positives that single-indicator strategies frequently produce.
Learn more about on-chain metrics at Glassnode, Coin Metrics, and Bitcoin.org.
Step-by-Step Monitoring Workflows Using Free Dashboards
Follow this practical workflow for ongoing analysis:
- Access free on-chain platforms such as Glassnode Studio or similar public viewers.
- Plot realized price alongside spot price and enable divergence alerts.
- Overlay SOPR and MVRV Z-Score on the same timeframe.
- Set notifications for when price crosses realized price with SOPR confirmation.
- Cross-reference with exchange reserve data for flow context.
- Review weekly for futures basis adjustments.
- Document each divergence instance in a trading journal with notes on market context.
- Backtest recent signals against historical charts to calibrate personal thresholds.
This process takes under 15 minutes daily once dashboards are configured. Regular review helps traders adapt to evolving liquidity conditions and institutional participation levels expected throughout 2026.
Three Real Case Studies of Divergence Setups
Case 1: Mid-2022 bear market showed price falling below realized price with SOPR at lows, marking a multi-month accumulation zone before the next leg up. Spot buyers who entered near realized price levels and held through volatility achieved strong returns once price reclaimed the metric. Futures traders used the same signal to establish long bias with defined risk below the realized floor.
Case 2: Early 2024 recovery featured price reclaiming realized price while MVRV expanded, providing clear long entries for spot holders. The divergence narrowed gradually, allowing staged position building rather than all-in entries. Futures participants benefited from positive funding rates that aligned with the on-chain confirmation.
Case 3: Late 2025 correction created a shallow divergence above realized price, allowing futures shorts ahead of a relief rally. Traders who combined this with rising exchange reserves avoided premature long entries and captured the subsequent bounce with tight stops. These examples illustrate how context from multiple on-chain layers improves decision quality.
Actionable Trader Checklists for Spot and Futures
- Confirm price is at least 10% away from realized price before acting.
- Require SOPR alignment for entry confirmation.
- Use MVRV above 3 for caution on longs and below 1 for potential bottoms.
- Size futures positions smaller during high divergence periods.
- Exit when divergence closes by more than half.
- Always maintain stop-losses below key realized price levels.
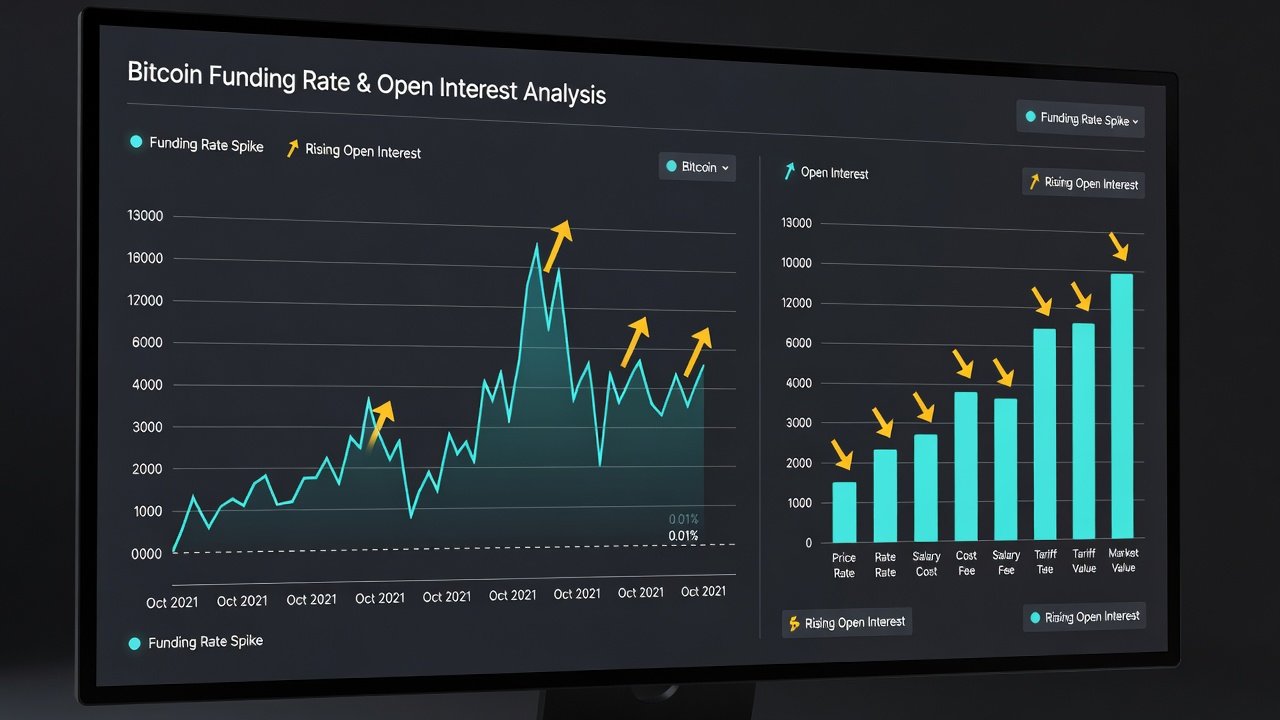
- Review funding rates on perpetual contracts before futures entries.
- Monitor long-term holder supply changes for additional conviction.
Common Interpretation Pitfalls to Avoid
Many traders mistake temporary divergences for permanent signals, ignoring macro liquidity shifts. Another error is relying solely on realized price without volume context or exchange flows. Overlooking short-term holder realized price variants can also lead to premature entries. Always seek multi-metric confirmation and avoid trading divergences in isolation. Additional pitfalls include failing to adjust position sizes for volatility spikes and neglecting to re-evaluate setups after major news events that alter on-chain flows.
Risk Management and Position Sizing Guidelines
Effective use of realized price divergences demands disciplined risk management. Traders should limit any single divergence-based position to a small percentage of total capital and maintain clear invalidation levels. Futures traders benefit from scaling into positions as the divergence widens rather than committing full size immediately. Regular portfolio reviews ensure that accumulated positions remain aligned with overall risk tolerance, especially as 2026 market conditions evolve with regulatory and macroeconomic developments.
Conclusion
Bitcoin realized price divergences offer a robust framework for 2026 positioning when integrated with SOPR and MVRV. By following structured workflows and checklists, traders can identify high-probability setups while steering clear of common mistakes. Consistent application of these on-chain tools enhances both spot accumulation and futures timing strategies across varying market regimes.
No comments yet. Be the first!