 CryptoChain Blog
Introduction to Bitcoin Reversal Signals in 2026
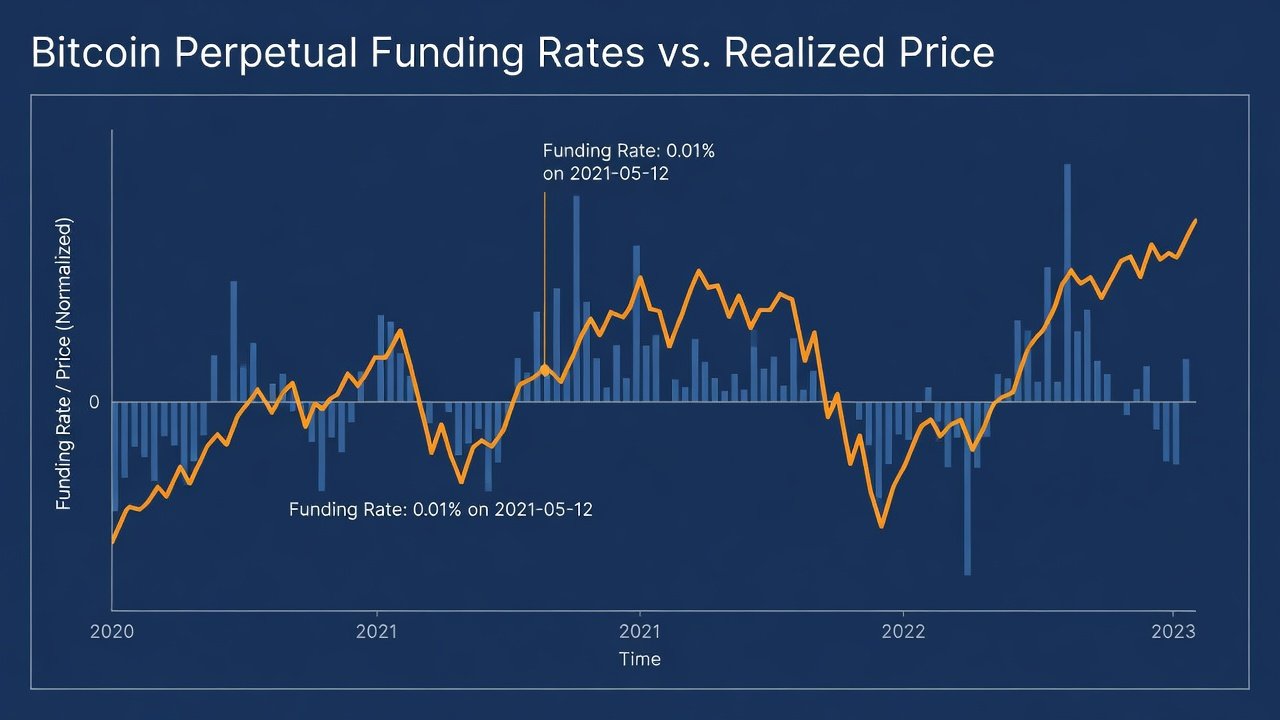
Bitcoin traders in 2026 are increasingly turning to the powerful combination of perpetual funding rates and realized price to identify high-probability reversal points. This playbook extends proven on-chain methodologies by focusing on direct divergences between these metrics, offering a robust framework for timing entries during extreme market conditions. As volatility persists into the new year, understanding these signals becomes essential for both retail and institutional participants seeking an edge over purely technical analysis approaches.
The 2026 landscape introduces new variables such as evolving regulatory frameworks and institutional adoption rates that amplify the importance of on-chain data. By pairing funding rates directly with realized price, traders can filter out noise and focus on moments when market sentiment has detached from underlying holder behavior. This method has shown strength in previous cycles and continues to evolve with better data accessibility.
Understanding Perpetual Funding Rates
Perpetual funding rates represent the periodic payments exchanged between long and short positions in perpetual futures contracts. Positive rates indicate bullish sentiment as longs pay shorts, while negative rates signal bearish dominance. In 2026, monitoring these rates helps detect overextended positions ahead of reversals. Rates are typically calculated every eight hours on major platforms and can spike during news events or leverage-driven rallies.
Extreme positive funding often precedes local tops because it reflects overcrowded long positions that become vulnerable to liquidation cascades. Conversely, deeply negative rates can mark capitulation bottoms. Traders must consider the magnitude and duration of these extremes rather than isolated readings for reliable signals.
Calculating Realized Price and Its Divergences
Realized price is derived from the average acquisition cost of all Bitcoin in circulation, calculated via on-chain data. Divergences occur when spot price deviates significantly from this realized baseline, often coinciding with funding rate extremes to flag potential turning points. Step-by-step calculation involves aggregating UTXO values and dividing by total supply, then comparing the result against current market price.
For example, when spot price trades 30 percent above realized price during positive funding spikes, historical patterns suggest heightened reversal risk. Real-time tracking is essential. Platforms like Glassnode provide detailed realized price charts, while Coinglass delivers live funding rate data across major exchanges. Cross-verifying multiple exchanges reduces single-source bias in 2026's fragmented liquidity environment.
Setting Up 2026-Specific Alerts
Configure alerts on Glassnode for realized price deviations exceeding 20 percent combined with funding rates above 0.05 percent or below -0.05 percent. Integrate Coinglass notifications for multi-exchange funding spikes. These setups allow traders to respond swiftly to 2026 market dynamics without constant screen time. Customize thresholds based on your risk tolerance and historical backtests from 2024-2025 data.
Advanced users can layer additional filters such as volume-weighted funding averages or time-weighted realized price to reduce false positives. Testing alert frequency during low-volatility periods ensures the system remains actionable rather than overwhelming.
Integrating SOPR and Exchange Flows
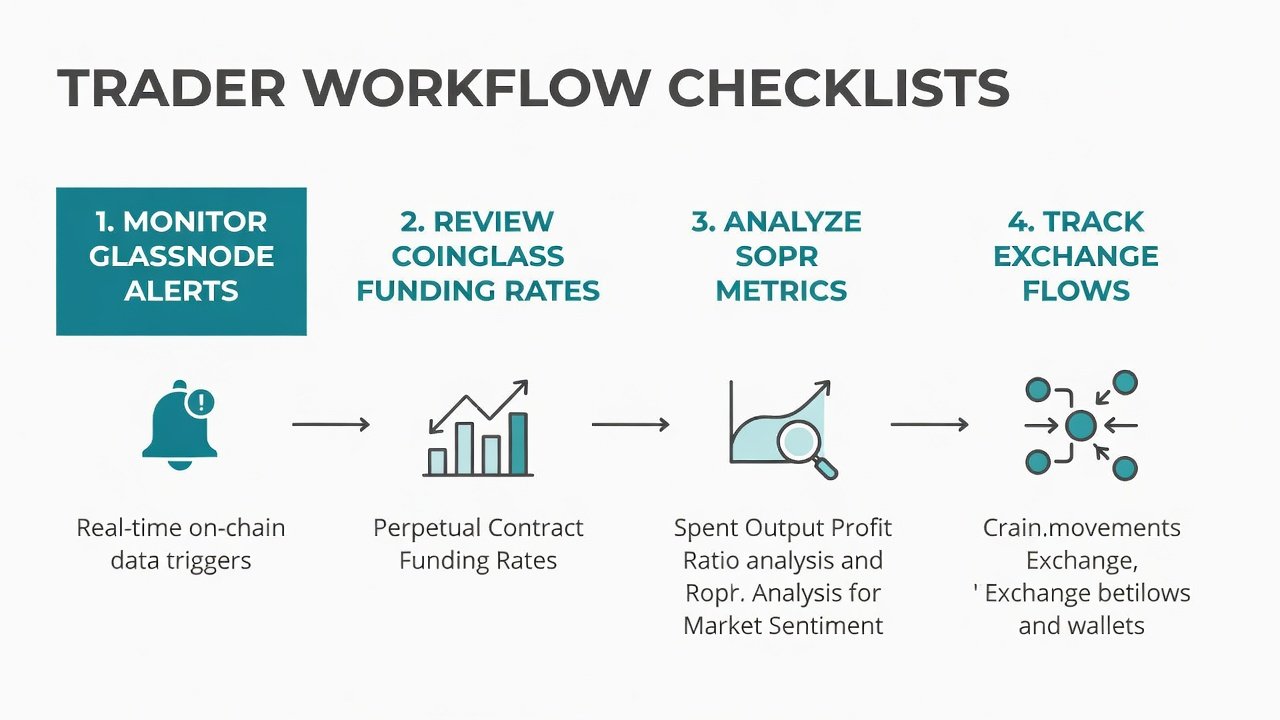
SOPR (Spent Output Profit Ratio) adds context by measuring whether coins are moved at profit or loss. Pairing it with funding rates and realized price reveals whether divergences are supported by actual holder behavior. When SOPR drops below 1 during negative funding and realized price compression, it often confirms seller exhaustion and sets up reversal opportunities.
Monitor exchange inflows via on-chain tools to confirm potential sell pressure during negative funding extremes. Large inflows coinciding with high positive funding can indicate distribution by long-term holders, strengthening reversal conviction. Combining these three metrics creates a multi-layered confirmation system that outperforms any single indicator.
Daily Workflow for Traders
Develop a repeatable daily process to stay ahead of signals. Review overnight funding rates on Coinglass at market open. Check Glassnode for realized price versus spot price gaps. Cross-reference with SOPR trends and exchange net flows. Log signals in a personal dashboard for historical comparison. Execute only when at least three metrics align on reversal probability.
Extend this workflow by reviewing weekly aggregates every Sunday to identify building divergences early. Incorporate macroeconomic calendar checks to avoid trading against scheduled events that could override on-chain signals. Documenting each trade's rationale improves pattern recognition over time.
Trader Checklists for Extreme Readings
Before entering a position during extreme funding or realized price readings, confirm multi-timeframe alignment, verify no major news events, assess overall market liquidity, and set strict stop-losses based on recent realized price levels. Additional checklist items include reviewing open interest trends and ensuring position sizing stays within predefined risk parameters.
Post-entry monitoring involves watching for funding normalization as a potential exit trigger. Re-evaluate the thesis if realized price begins converging faster than anticipated.
Common Pitfalls to Avoid
Traders often ignore lag in on-chain data or over-rely on single-exchange funding rates. Another frequent mistake is entering without confirming exchange flow confirmation, leading to false signals in choppy 2026 conditions. Avoid revenge trading after missed signals and resist the urge to average down without fresh metric alignment.
Over-optimization of alert thresholds based on recent data can also reduce robustness. Maintain a balance between sensitivity and specificity by periodically reviewing historical performance.
Free Dashboard Examples
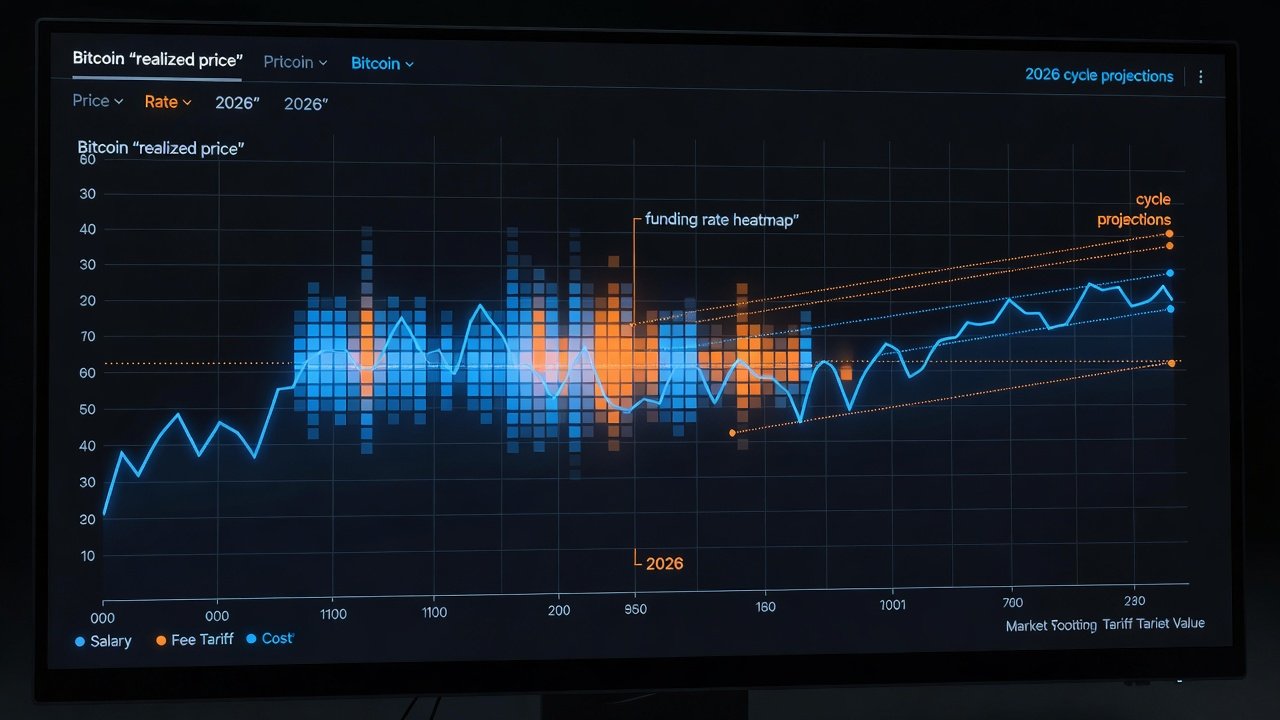
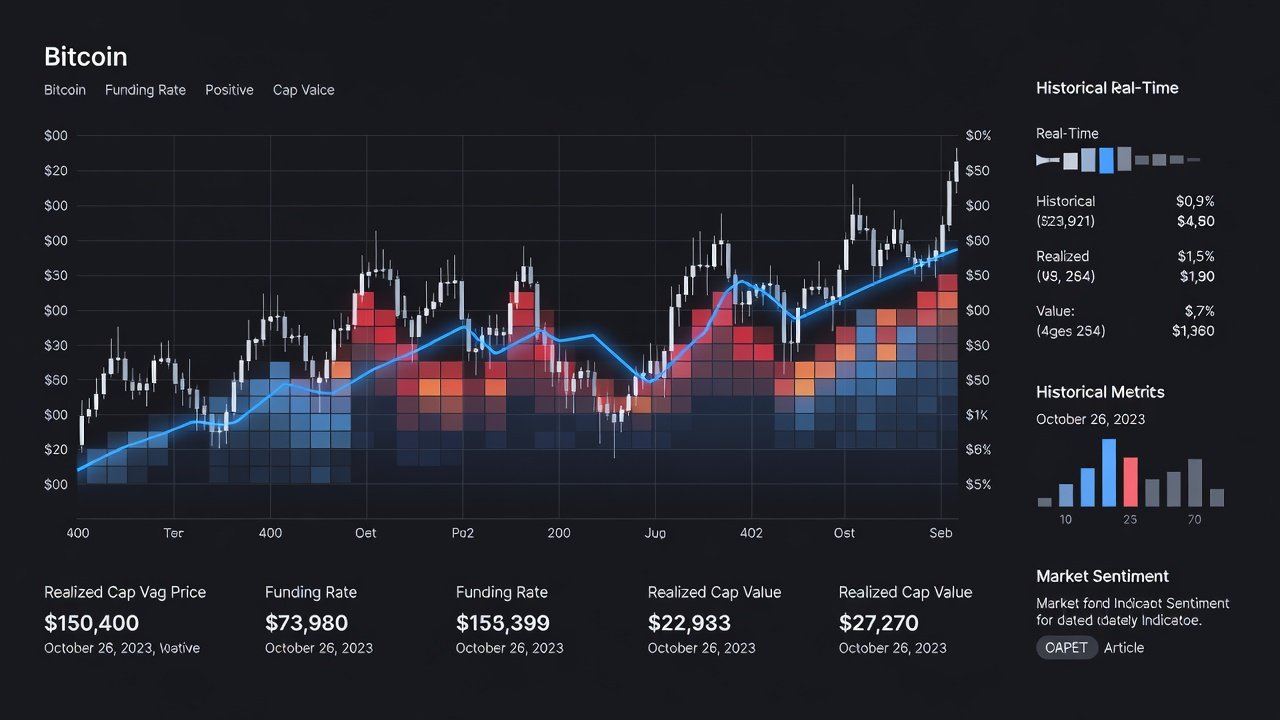
Build simple dashboards using Glassnode widgets combined with Coinglass API feeds. Free tiers allow basic realized price overlays and funding heatmaps for daily monitoring without paid subscriptions. Examples include a three-panel view showing funding rate heatmaps, realized price deviation charts, and SOPR line graphs side by side.
Many traders export data to spreadsheets for custom calculations, adding columns for divergence scores and historical comparison. This keeps the process transparent and adaptable as new data emerges in 2026.
FAQ on Timing Entries
How do I time entries during extreme funding rates?
Wait for funding normalization alongside realized price convergence before committing capital. Combine with volume confirmation to increase probability.
What role does realized price play in 2026 reversals?
It acts as a fair-value anchor, highlighting when speculative price action has detached too far from holder cost basis and often precedes mean-reversion moves.
Can SOPR improve signal accuracy?
Yes, positive SOPR during negative funding often confirms capitulation and reversal potential, while negative SOPR during positive funding can validate distribution phases.
How frequently should I review these metrics?
Daily checks suffice for most traders, with deeper weekly reviews to spot emerging multi-week divergences that lead to larger swings.
Conclusion
Mastering the pairing of funding rates with realized price equips Bitcoin traders with a data-driven edge for 2026. Consistent application of the workflows and checklists outlined here supports disciplined decision-making amid volatile conditions. Stay vigilant with real-time tools from Glassnode and Coinglass to capture timely reversals while managing risk through structured processes.
No comments yet. Be the first!