 CryptoChain Blog
Introduction to Bitcoin Reversal Signals in 2026
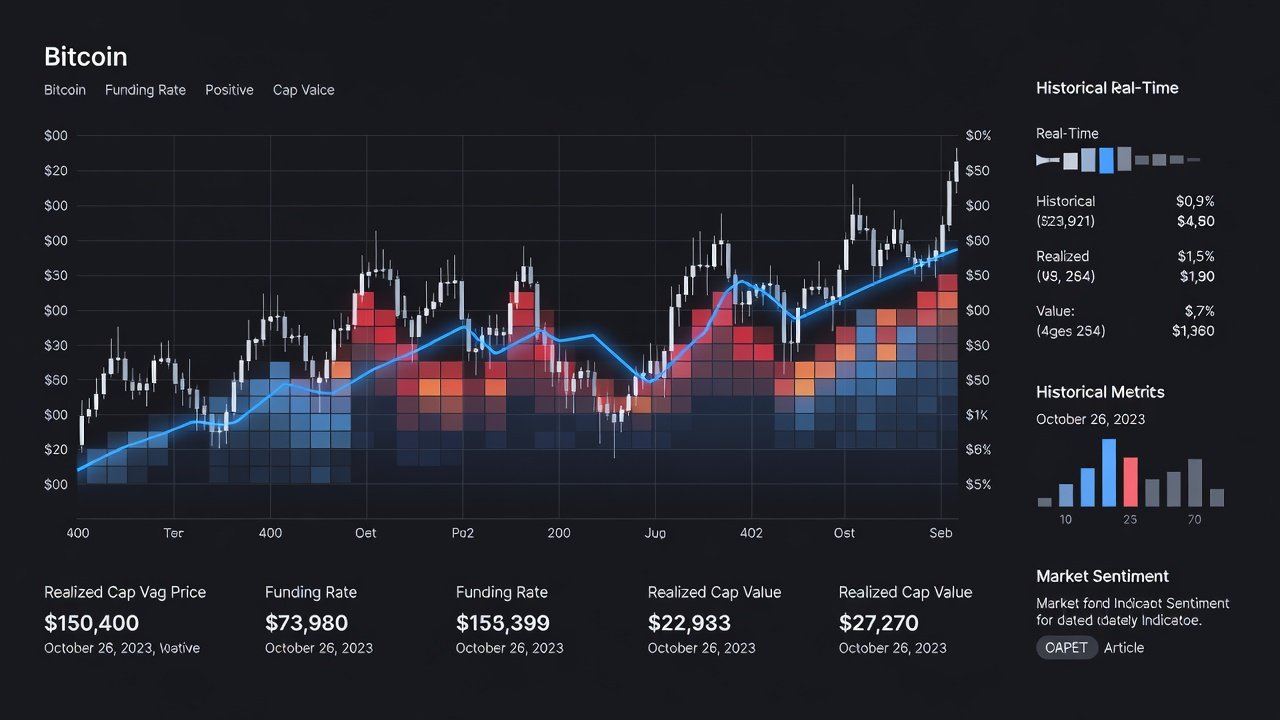
Traders seeking an edge in volatile crypto markets can combine perpetual futures funding rates with realized cap data to pinpoint potential Bitcoin reversals. This approach leverages divergences between market sentiment in derivatives and on-chain fundamentals. In 2026, with maturing institutional participation, these metrics offer clearer signals when used together. The playbook provides a complete framework for spotting exhaustion points, managing entries, and protecting capital during uncertain conditions. By the end of this guide, readers will understand the underlying mechanics, have access to step-by-step workflows, and possess checklists for daily analysis routines that adapt to evolving market structures.
Understanding Perpetual Futures Funding Rates
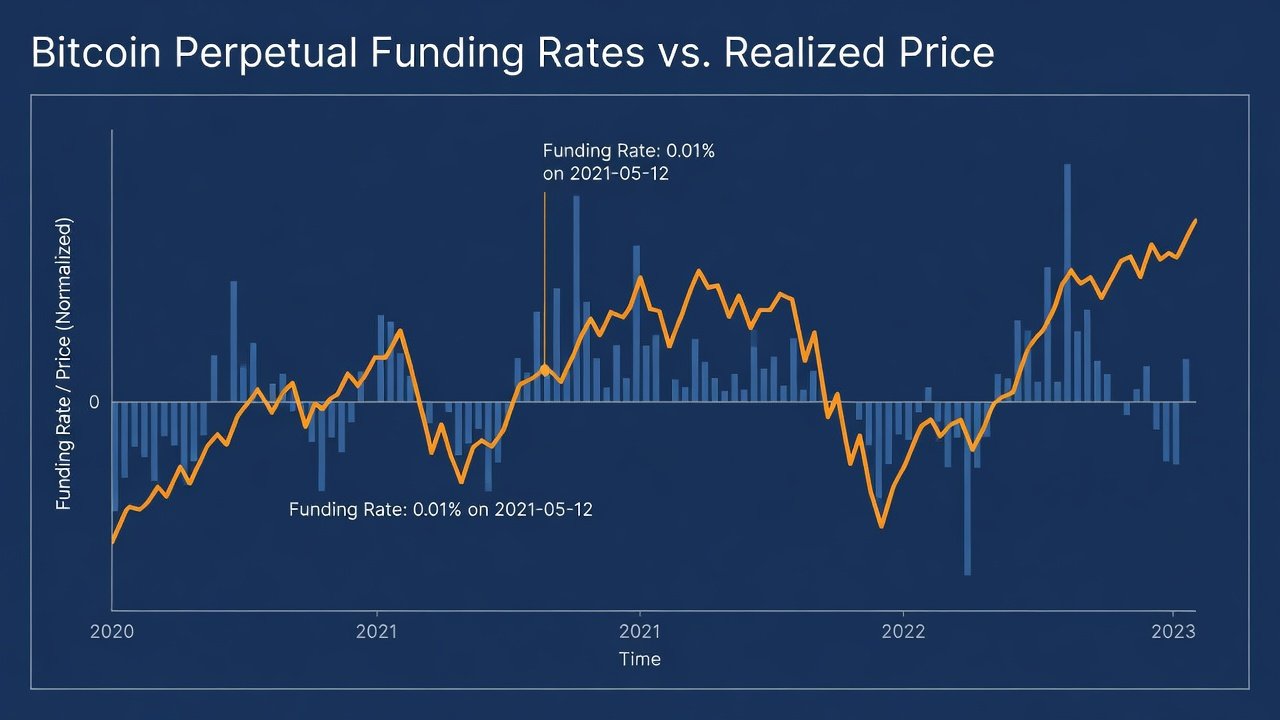
Funding rates represent periodic payments between long and short positions in perpetual contracts. Positive rates indicate longs pay shorts, signaling bullish dominance. Extreme positive or negative rates often precede reversals as positions become overcrowded. The calculation occurs every eight hours on most platforms and is derived from the premium or discount of the perpetual contract relative to the spot index price. When funding stays elevated for multiple periods, it reflects leveraged optimism that can unwind quickly once sentiment shifts.
Historical patterns show that rates exceeding 0.1% for several consecutive intervals frequently coincide with local tops, while deeply negative rates below -0.05% mark capitulation zones. Traders monitor aggregated exchange data to avoid single-platform bias. This metric captures crowd psychology in the derivatives market, which often leads spot price action by several hours or days.
Key Drivers Behind Funding Extremes
Leverage availability, news catalysts, and macro liquidity all influence funding. During bull runs, retail and institutional traders pile into long positions, pushing rates higher. In contrast, bearish events such as regulatory announcements trigger short cascades that drive rates negative. Understanding these drivers helps contextualize whether an extreme reading is sustainable or ripe for reversal.
The Role of Realized Cap in Market Structure
Realized cap measures the aggregate value of Bitcoin at the price when each coin last moved on-chain. It acts as dynamic support or resistance because it reflects the average cost basis of holders. When price approaches realized cap from above, it can signal capitulation; from below, it may indicate accumulation. Unlike market cap, which weights all coins at the current spot price, realized cap discounts lost or dormant coins, providing a cleaner view of active economic activity.
This on-chain metric often serves as a floor during corrections because holders are less likely to sell below their realized entry price. Conversely, when price rallies above realized cap by a wide margin, profit-taking pressure increases. In 2026 conditions, with higher institutional custody, realized cap levels may become even more pronounced as large entities defend their cost bases.
Comparing Realized Cap to Other On-Chain Indicators
While MVRV ratio offers valuation context, realized cap gives absolute price levels that traders can watch directly on charts. It complements transaction volume and active address counts by adding a cost-basis layer. Combining it with funding rates creates a multi-dimensional view that single-metric strategies lack.
Fusing Funding Rates with Realized Cap for Reversals
High-probability setups emerge when funding rates reach extremes while price tests realized cap levels. For instance, deeply negative funding coinciding with price near realized cap often marks local bottoms as shorts become overcrowded and buyers step in at cost basis. This confluence increases the odds of a bounce because both derivatives and spot participants align on a reversal.
Conversely, euphoric positive funding near overhead realized cap resistance warns of tops. The divergence highlights when derivatives sentiment decouples from on-chain reality. Traders watch for funding normalization after the initial test of realized cap to confirm the reversal direction before committing capital.
Step-by-Step Workflow Using Coinglass and Glassnode
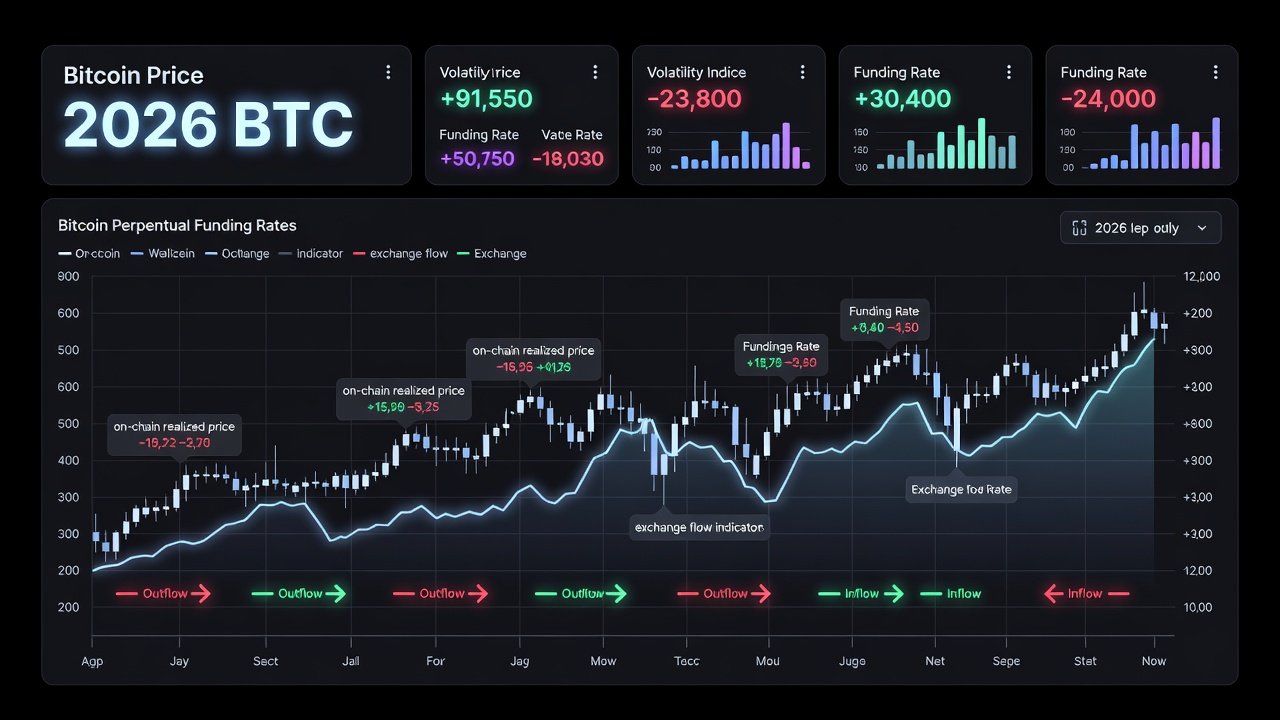
Follow this repeatable process for 2026 analysis. Begin by pulling real-time funding data across major exchanges. Next, load realized cap charts and identify proximity zones. Correlate findings with open interest trends to gauge leverage risk. Finally, configure alerts that trigger only when both conditions align.
- Access aggregated funding rates on Coinglass and filter for Bitcoin perpetual pairs.
- Navigate to Glassnode and select the realized cap metric for Bitcoin.
- Plot price against realized cap and note distance in percentage terms.
- Cross-reference open interest changes over the past 24-48 hours.
- Set custom alerts for funding above 0.08% or below -0.06% when price is within 5% of realized cap.
- Validate signals with exchange inflow/outflow data before execution.
Advanced users can export data into spreadsheets for historical backtesting of similar setups.

2024-2025 Case Studies and Open Interest Correlations
Historical examples from prior cycles demonstrate the method. In late 2024, negative funding rates aligned with price testing realized cap support, preceding a sharp recovery as open interest reset lower. The combination provided an early entry signal several days before the broader market recognized the bottom. Similarly, early 2025 saw positive funding extremes near resistance levels trigger corrections when realized cap acted as a ceiling. Open interest expanded rapidly during these periods, amplifying the subsequent reversal once funding normalized and leveraged positions were liquidated.
Another notable instance occurred mid-2025 when funding flipped from positive to neutral exactly at realized cap resistance. This transition coincided with a measurable drop in open interest, confirming distribution rather than accumulation. These cases illustrate how the two metrics together filter out false signals that appear when analyzing either indicator in isolation.
Risk Management Rules and Practical Checklists
Always size positions conservatively, risking no more than 1-2% of capital per trade. Place stop-losses below the nearest realized cap cluster or above key resistance when shorting. Avoid entering solely on funding extremes without realized cap confirmation. Monitor for sudden macro shifts that can override technical setups.
Common Mistakes to Avoid
- Ignoring multi-exchange funding aggregation and trading off a single venue reading
- Entering before funding normalizes after the initial extreme
- Overlooking open interest spikes that indicate crowded trades
- Disregarding broader market liquidity conditions during major news events
Daily Analysis Checklist
- Verify exchange-wide funding aggregation on Coinglass
- Confirm realized cap test with multiple Glassnode metrics including adjusted versions
- Assess macro liquidity conditions and upcoming economic releases
- Document open interest changes pre-trade and post-entry
- Review recent whale wallet movements for additional context
Preparing Analysis Routines for 2026 Market Conditions
As institutional flows grow, realized cap may exhibit stronger reactions at key levels. Update workflows quarterly to account for new derivatives products and on-chain data enhancements. Backtest the combined strategy across multiple market regimes to refine alert thresholds. Maintain a trading journal that logs every signal, outcome, and lesson learned to improve repeatability.
Conclusion
Integrating funding rates with realized cap equips traders with a robust framework for 2026 Bitcoin reversals. Consistent application through the outlined workflows builds repeatable edge while managing downside risk effectively. By focusing on confluence rather than isolated readings, analysts can navigate the next cycle with greater precision and discipline.
No comments yet. Be the first!