 CryptoChain Blog
Introduction to Bitcoin Realized Price and Funding Rate Combinations
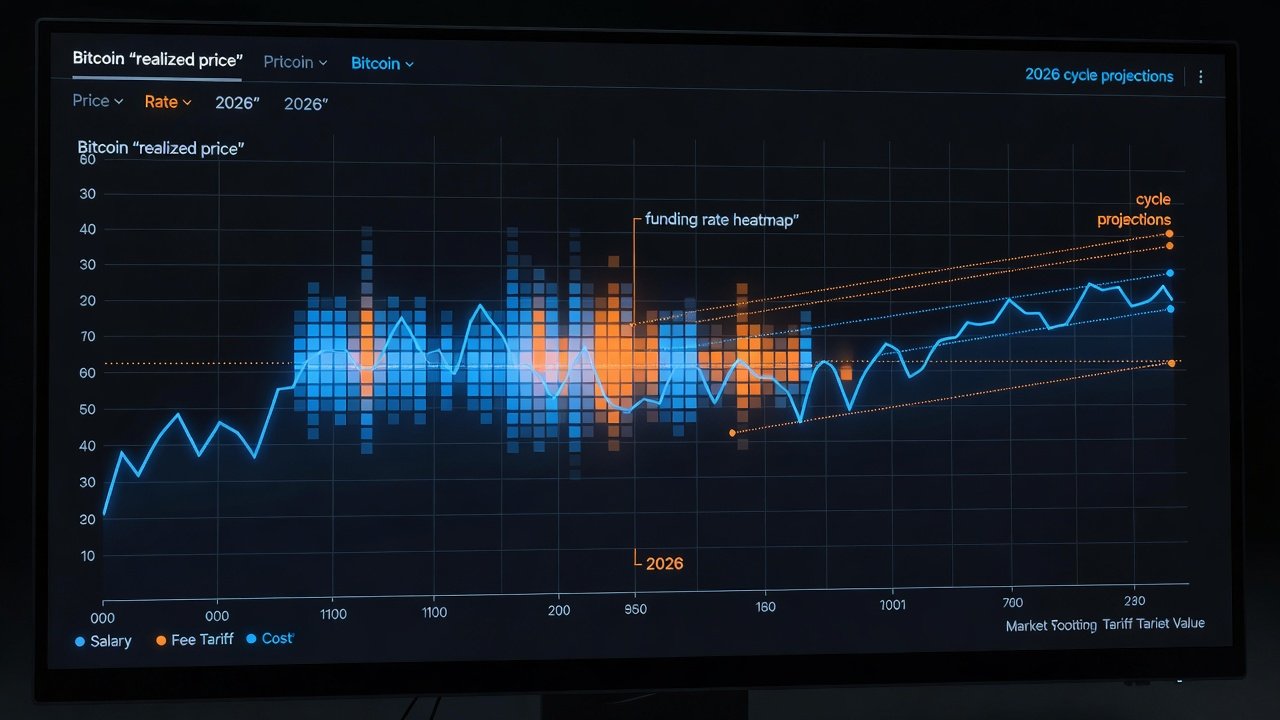
Traders seeking an edge in 2026 Bitcoin markets are turning to the powerful combination of realized price and funding rates. This approach moves beyond isolated metrics to create high-probability setups that have historically aligned with major cycle turning points. By blending on-chain data with derivatives sentiment, market participants can identify divergences and confirm trends with greater confidence. The strategy emphasizes actionable workflows that help traders respond quickly to shifting conditions rather than relying on theoretical models alone.
Realized price reflects the average cost basis of all Bitcoin in circulation, while funding rates reveal perpetual futures market bias. When used together, they highlight periods where spot holders and leveraged traders align or diverge, often preceding significant price moves. This dual-metric lens has proven especially useful during volatile periods when single indicators produce false signals.
Understanding Realized Price: Calculation and Significance
Realized price is derived from on-chain transaction data. It calculates the average price at which each Bitcoin last moved, weighted by the supply held at that price. Unlike market price, it shows the collective cost basis of holders rather than the last traded value. This metric acts as a dynamic support or resistance level because it represents the average entry point for current holders.
To calculate realized price step-by-step: first, aggregate the realized capitalization by summing (price at last movement × amount moved) for all coins. Then divide by the total circulating supply. Free tools from platforms like Glassnode simplify this process for traders without custom scripts. In practice, monitor daily changes in realized price to spot when new capital enters the market at higher or lower levels, providing early clues about holder conviction.
Decoding Funding Rates for Market Sentiment
Funding rates in perpetual swaps indicate whether long or short positions dominate. Positive rates mean longs pay shorts, signaling bullish leverage. Negative rates show the opposite. Persistent extremes often precede reversals as over-leveraged positions unwind. Funding rates reset every eight hours on most exchanges, making intraday monitoring essential for precise timing.
Monitoring average funding rates across major exchanges provides a clearer picture than single-venue data. Historical extremes above 0.05% or below -0.03% per 8-hour period have frequently coincided with local tops and bottoms in prior cycles. Traders should also track open interest alongside funding rates to gauge whether the leverage buildup is sustainable or fragile.
Combining the Metrics for 2026 Trade Setups
The combo strategy shines when realized price acts as dynamic support or resistance while funding rates confirm or contradict momentum. For example, when spot price trades above realized price and funding rates turn sharply positive, it often signals strong conviction but also potential overextension. This setup invites caution and preparation for mean-reversion trades.
Conversely, price below realized price paired with negative funding rates can mark capitulation zones. Traders watch for funding rate normalization while price holds above realized price as a bullish confirmation signal. The combination reduces noise by requiring both on-chain and derivatives alignment before committing capital.
Historical Pattern Confirmation from Prior Cycles
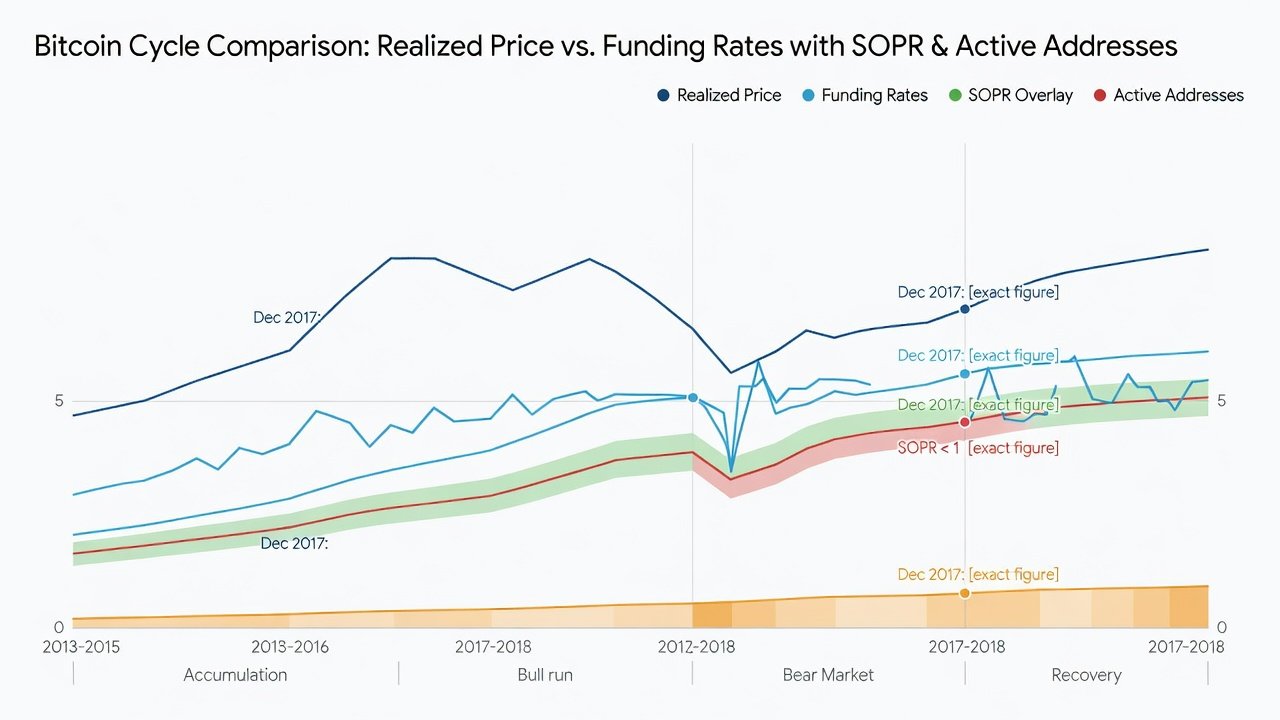
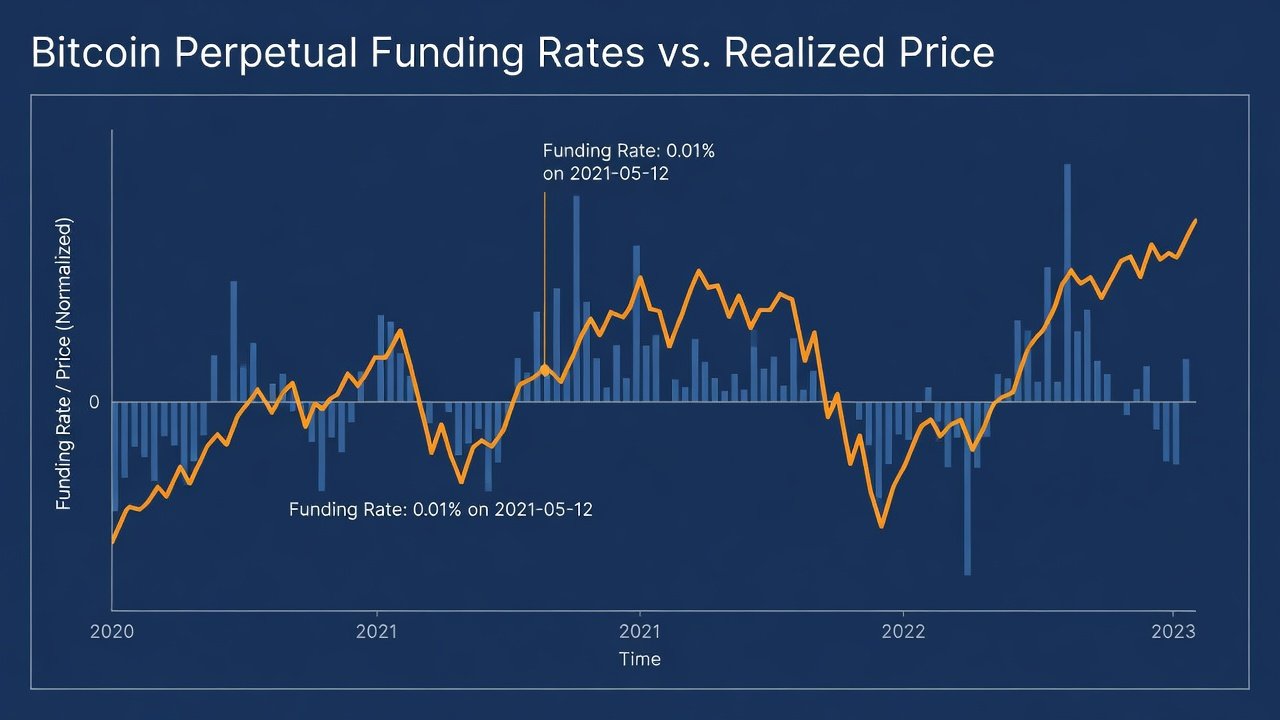
Analysis of 2017 and 2021 cycles shows repeatable patterns. In late 2017, realized price provided a floor during the final rally while funding rates spiked to record positives before the correction. Similar dynamics appeared in early 2021 when funding rates remained elevated as price hovered near realized levels, foreshadowing the May pullback. The 2025 halving cycle introduced additional nuance as institutional flows altered the speed of these signals.
These patterns suggest that 2026 setups will likely follow analogous structures, especially around halving-cycle peaks. Cross-referencing with active address growth adds another layer of confirmation and helps filter out low-conviction moves that lack broad network participation.
Integrating SOPR and Active Addresses
SOPR (Spent Output Profit Ratio) measures whether coins are being spent in profit or loss. Values above 1 indicate profitable spending, often aligning with bull markets. When combined with the realized price and funding rate framework, SOPR divergences can flag weakening trends early. For instance, rising realized price with falling SOPR values may indicate that newer buyers are underwater while older holders take profits.
Active addresses serve as a proxy for network adoption. Rising active addresses alongside favorable realized price and funding rate alignments strengthen bullish cases. Declining addresses during positive funding periods may warn of fading participation. Traders can create simple scoring systems that award points for alignment across all four metrics, raising the bar for trade execution.
Free Monitoring Dashboards and Workflows
Traders can build actionable dashboards using Glassnode for realized price and SOPR metrics alongside Coinglass for real-time funding rate data. Set alerts for realized price crossovers and funding rate thresholds above 0.04% or below -0.02%. Additional layers from Bitcoin.org resources provide foundational context on network fundamentals.
A daily workflow includes: checking overnight funding averages, comparing current price to realized price, reviewing SOPR, and confirming with 7-day active address trends. This routine takes under 15 minutes once dashboards are configured. Weekly reviews can incorporate multi-timeframe funding rate averages to identify persistent bias versus short-term noise.
Practical Entry and Exit Examples
Consider a 2026 scenario where Bitcoin trades 8% above realized price with funding rates at +0.06%. A trader might enter long positions on a funding rate cooldown below +0.03% while price remains above realized levels, targeting the next resistance cluster. Position sizing should remain conservative until SOPR confirms the move with values staying above 1.05.
For exits, watch for price dropping below realized price concurrent with funding rates flipping negative. This combination has historically preceded deeper corrections, prompting profit-taking or hedge activation. Another example involves scaling out of positions when active addresses plateau while funding rates remain elevated, protecting gains before momentum fades.
Common Pitfalls to Avoid
- Ignoring exchange-specific funding distortions by relying on single-venue data instead of aggregated metrics.
- Treating realized price as static support without monitoring SOPR shifts that reveal changing holder behavior.
- Over-leveraging during extreme funding periods without waiting for normalization and confirmation from active addresses.
- Neglecting active address trends that can invalidate on-chain signals during periods of low network usage.
- Failing to account for weekend gaps or low-liquidity hours that exaggerate funding rate spikes.
FAQ: Spotting Real-Time Divergences
How do I identify a realized price divergence? Compare price action with realized price on daily charts; sustained moves away from realized levels without corresponding funding confirmation often signal exhaustion. Watch for price making new highs while realized price flattens.
What funding rate threshold triggers alerts? Set notifications for 8-hour rates exceeding +0.05% or falling below -0.025% as of late 2026 observations. Combine these with volume filters to avoid false positives during thin trading.
Can this strategy work in bear markets? Yes, negative funding combined with price below realized price has marked capitulation bottoms in past cycles. Adding SOPR below 1 provides extra confirmation of seller exhaustion.
How often should I re-evaluate positions? Review the full metric set at least daily and adjust alerts for major news events that could shift funding dynamics rapidly.
Conclusion
Combining Bitcoin realized price with funding rates delivers a robust framework for navigating 2026 volatility. By following structured workflows, integrating SOPR and address data, and avoiding common pitfalls, traders position themselves for higher-probability decisions. Consistent monitoring through established dashboards turns these concepts into repeatable edge. The emphasis on real-time execution and multi-metric confirmation helps maximize the practical value of these signals throughout the cycle.

No comments yet. Be the first!