 CryptoChain Blog
Introduction to Lightning Network Metrics for Bitcoin Analysis
The Lightning Network continues to evolve as a critical layer-2 solution for Bitcoin, enabling faster and cheaper transactions. In 2026, analyzing its metrics offers traders and analysts a deeper view beyond simple price charts, revealing scalability trends that influence adoption and long-term value. This guide covers essential metrics including network capacity, node growth, payment volumes, and liquidity distribution, with practical examples tailored to current market conditions. By examining these indicators, users can better understand how the Lightning Network supports Bitcoin's growth amid increasing global demand for efficient digital payments.
Understanding these metrics helps interpret how the Lightning Network addresses Bitcoin's scalability challenges. Search intent around this topic often focuses on real-world impacts, such as how increased capacity correlates with broader adoption during volatile periods. The network's development in 2026 highlights improvements in routing efficiency and channel management that directly affect user experience and merchant integration.
Key Lightning Network Metrics Explained
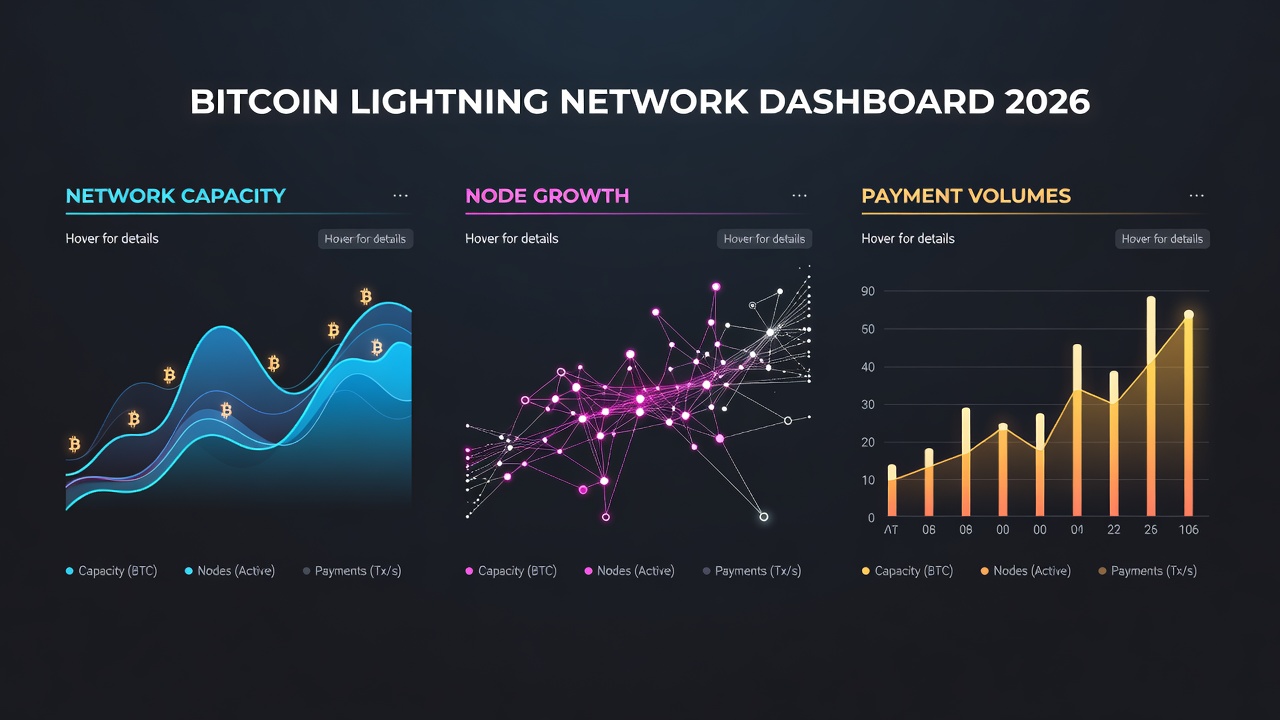
Network Capacity
Network capacity measures the total bitcoin locked in payment channels. It reflects the network's ability to handle transaction volume without congestion. In 2026, capacity growth indicates maturing infrastructure, often aligning with institutional interest in Bitcoin payments. Analysts track this metric to gauge overall liquidity available for instant transfers, noting that sustained increases typically precede higher adoption rates among payment processors and exchanges.
Node Growth and Distribution
Tracking the number of active nodes and their geographic spread shows decentralization progress. Rising node counts suggest greater resilience, while concentration in certain regions may highlight risks. In 2026 examples, node growth has been particularly strong in emerging markets, where users leverage the network for cross-border remittances with minimal fees compared to traditional systems.
Payment Volumes and Liquidity
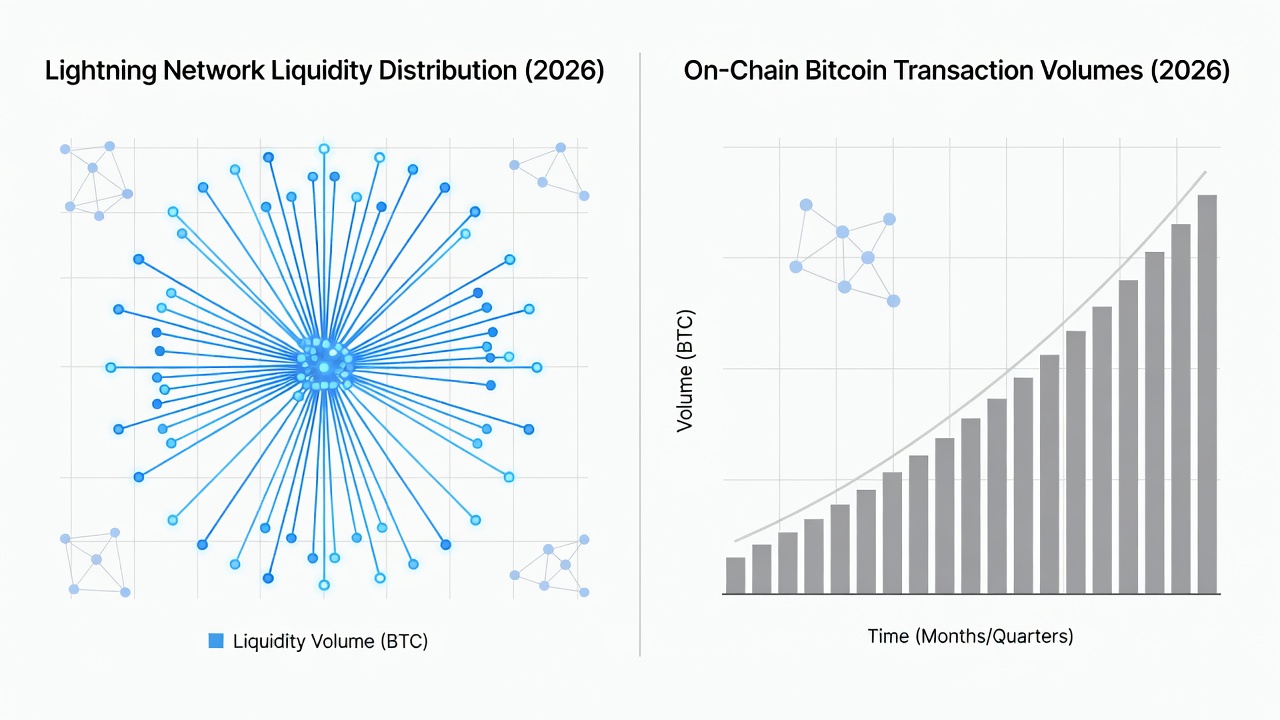
Payment volumes track routed transactions, while liquidity distribution reveals how efficiently funds flow across channels. Balanced liquidity supports seamless user experiences and higher adoption rates. Uneven distribution can lead to routing failures, so monitoring this helps identify opportunities for channel rebalancing strategies.
Step-by-Step Guide to Sourcing and Interpreting Public Dashboards
- Visit reputable public explorers such as those hosted by established Lightning projects to view real-time capacity and node data. Start by accessing overview pages that aggregate global statistics for an immediate snapshot.
- Filter metrics by time periods to identify 2026 trends, comparing weekly or monthly changes. This reveals seasonal patterns, such as spikes during holiday shopping periods when micropayments increase.
- Cross-reference with on-chain Bitcoin data from sources like bitcoin.org to spot divergences, such as Lightning handling more micropayments while the base layer sees fewer but larger settlements.
- Interpret liquidity heatmaps to assess routing efficiency and potential bottlenecks. Look for clusters of high-capacity nodes that serve as hubs for major transaction flows.
- Export historical datasets where available and import them into analysis tools for custom visualizations, enabling deeper correlation studies with price movements.
- Verify data consistency across multiple dashboards to avoid anomalies caused by temporary node offline events or reporting delays.
Comparisons to On-Chain Bitcoin Activity
Lightning Network activity often complements on-chain metrics. For instance, spikes in Lightning payment volumes during 2026 may coincide with reduced on-chain fees, signaling effective offloading of small transactions. Analysts should monitor both to forecast scalability benefits, noting that Lightning typically processes thousands of transactions per second versus Bitcoin's base layer limits. In practical terms, a surge in Lightning volume alongside steady on-chain hash rate growth suggests healthy ecosystem expansion rather than speculative trading alone. This dual analysis helps distinguish between short-term hype and sustainable network utility improvements.
Understanding Scalability Impacts on Bitcoin Adoption and Price
Scalability remains a core driver of Bitcoin's long-term viability. The Lightning Network mitigates base-layer constraints by enabling high-frequency, low-value transfers. In 2026, metrics showing rapid capacity expansion often align with increased merchant onboarding, which in turn supports price stability during periods of high volatility. Traders can use these signals to anticipate demand shifts, particularly when payment volumes rise in tandem with positive regulatory developments worldwide.
Practical Tips for Traders Using These Metrics
- Monitor capacity surges as early signals of adoption waves that could influence Bitcoin price momentum over the following weeks.
- Use node growth data to evaluate network health before entering positions tied to payment ecosystem developments or infrastructure projects.
- Compare liquidity distribution across major hubs to identify stable routing paths for any Lightning-based strategies or arbitrage opportunities.
- Avoid over-relying on single metrics; combine them with broader market indicators such as exchange inflows and social sentiment for balanced forecasts.
- Track changes in average channel size to understand whether the network is attracting larger institutional participants or remaining focused on retail use cases.
- Set up alerts for sudden drops in active nodes, which may indicate temporary technical issues rather than fundamental declines.
Common Mistakes to Avoid
Traders sometimes ignore seasonal fluctuations in payment volumes or misread node growth without accounting for inactive channels. Always verify data freshness on dashboards and consider external factors like regulatory updates affecting Bitcoin usage. Another frequent error involves overlooking the difference between total capacity and usable liquidity, leading to overly optimistic projections about transaction success rates.
Advanced Techniques for Forecasting with Lightning Data
Advanced users can build simple regression models correlating Lightning payment volumes with subsequent Bitcoin price movements. Historical 2026 patterns show that sustained volume growth above baseline levels often precedes positive price momentum within 30 days. Combining this with on-chain settlement data provides a more robust framework than relying on price charts in isolation.
FAQ
How do Lightning metrics predict Bitcoin adoption?
Higher capacity and payment volumes often precede increased merchant acceptance and user growth, providing forward-looking signals for ecosystem expansion.
Are these metrics better than price charts alone?
Yes, they offer context on underlying network utility, helping distinguish speculative moves from fundamental improvements in scalability and usability.
Where can I find the most accurate 2026 data?
Public dashboards from core Lightning development teams provide transparent, regularly updated statistics that are widely trusted by analysts.
What role does liquidity distribution play in price forecasts?
Well-distributed liquidity supports higher transaction success rates, which can drive adoption and indirectly influence market sentiment and pricing.
Can beginners effectively use these metrics?
Yes, starting with basic capacity and node counts allows newcomers to build intuition before progressing to more complex liquidity and volume analyses.
Conclusion
Mastering Lightning Network metrics equips Bitcoin enthusiasts with actionable insights for 2026 and beyond. By systematically sourcing data, making on-chain comparisons, and applying trader-focused tips, users can better anticipate scalability-driven shifts in the ecosystem and make more informed decisions.

No comments yet. Be the first!