 CryptoChain Blog
Introduction to Bitcoin Mempool Analysis in 2026
The Bitcoin mempool serves as a critical leading indicator for traders seeking to anticipate fee volatility and overall network health. In 2026, with increasing institutional participation and layered protocol developments, mempool data provides actionable insights that often precede price movements by hours or even days. This guide explores advanced techniques for interpreting mempool congestion, building fee estimation models, and combining these signals with on-chain metrics to generate predictive trading edges. Understanding the mempool allows traders to time entries and exits more effectively while avoiding costly fee spikes during periods of network stress.
Traders who master mempool analysis gain visibility into pending transaction demand that is invisible on price charts alone. The mempool reflects real-time supply and demand for block space, making it one of the purest on-chain sentiment gauges available. Throughout 2026, events such as ETF inflows, regulatory announcements, and macroeconomic releases have repeatedly demonstrated how mempool behavior can foreshadow both fee surges and subsequent price reactions.
Understanding Mempool Congestion Patterns
Mempool congestion occurs when the volume of unconfirmed transactions exceeds the capacity of blocks to clear them efficiently. Traders monitor the size of the mempool in virtual bytes (vBytes) alongside the distribution of fee rates across different priority levels. Persistent high congestion typically signals upcoming fee spikes, especially during periods of market volatility or when large batches of transactions enter the queue simultaneously.
Key patterns include rapid mempool growth during news events and asymmetric fee distributions where low-fee transactions accumulate at the bottom. By tracking these over time, analysts can distinguish between temporary spikes and structural shifts in network demand. For instance, a steady climb in mempool size over several hours often indicates organic user activity rather than coordinated spam, providing a more reliable signal for fee forecasting.
Visualizing Fee Rate Distributions
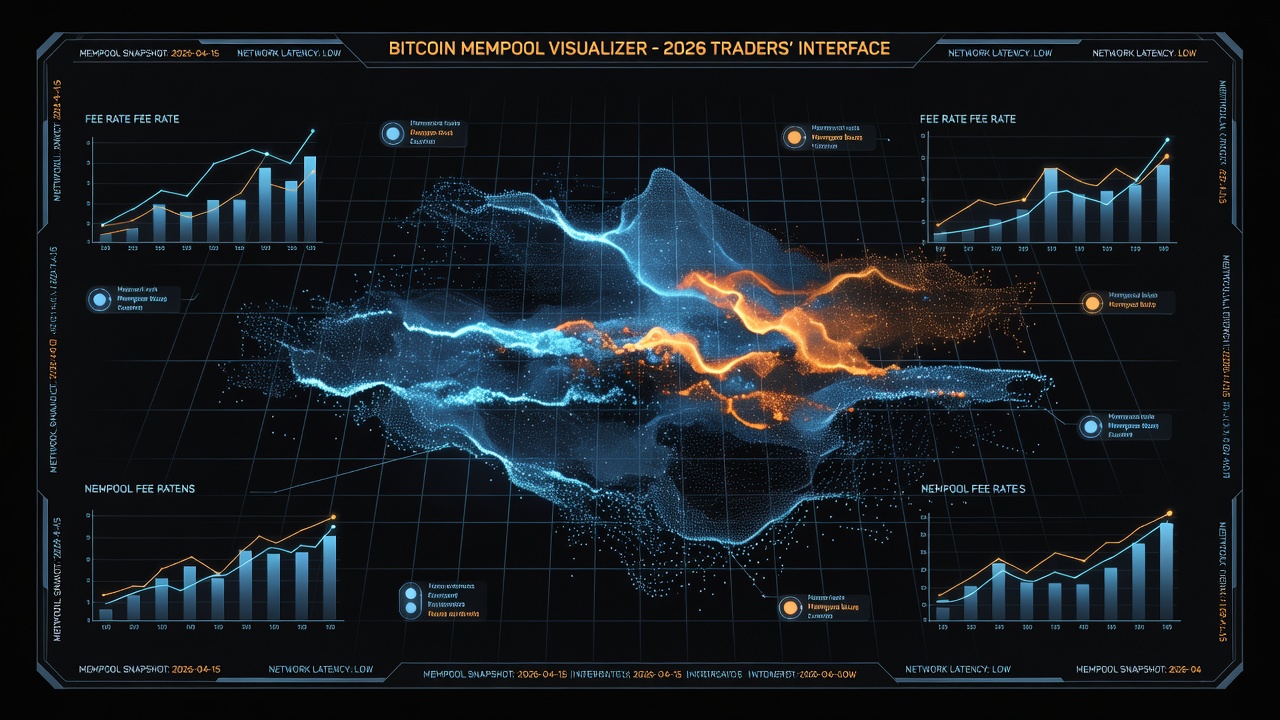
Fee rate distributions reveal how different transaction priorities compete for block inclusion. A healthy distribution shows a clear gradient from high-fee to low-fee transactions, while a flattened curve suggests extreme competition at multiple levels. Traders frequently examine the percentage of transactions paying above certain sat/vB thresholds to gauge urgency in the queue.
Fee Estimation Models for Predictive Trading
Effective fee estimation goes beyond simple averages. Traders build models that weigh historical fee rate percentiles against current mempool depth. For example, comparing the 50th and 90th percentile fee rates helps forecast how quickly a transaction will confirm under varying load conditions. These models can be refined by incorporating time-of-day patterns and historical responses to similar congestion levels.
Advanced approaches incorporate machine learning on mempool snapshots to predict fee trajectories 1-6 hours ahead. These models prove especially useful during high-volatility windows when traditional estimators lag behind actual network conditions. Combining percentile analysis with regression techniques allows traders to generate probability distributions rather than single-point estimates, improving decision confidence.
Integrating Mempool Data with On-Chain Metrics
Combining mempool signals with metrics such as active addresses, transaction volume, and hash rate creates a more robust predictive framework. A surge in mempool size paired with rising active addresses often confirms genuine demand rather than spam activity. Conversely, mempool growth without corresponding increases in unique addresses may indicate artificial pressure that is unlikely to persist.
This multi-metric approach reduces false positives and provides clearer entry or exit signals for traders managing positions around network events. Additional layers such as exchange reserve flows and long-term holder behavior can further validate whether congestion is driven by speculative trading or fundamental network usage.
Step-by-Step Guidance Using Free Tools
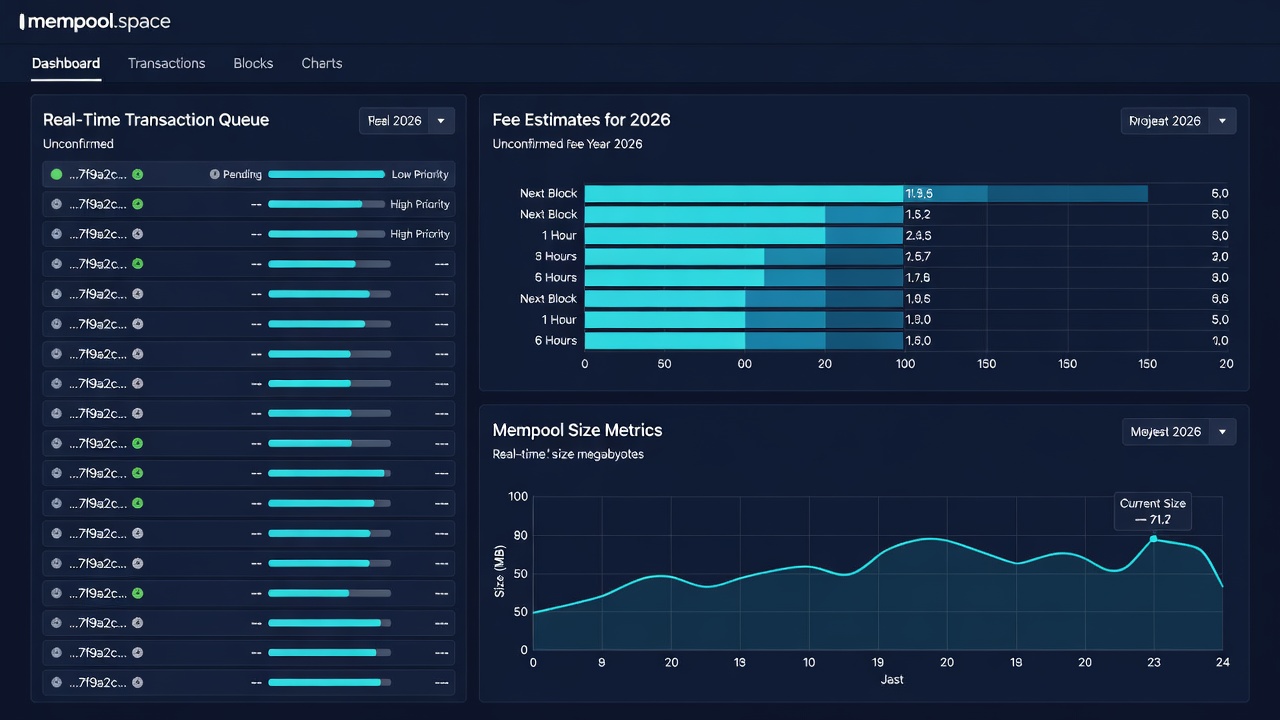
Start with the public dashboard at mempool.space to visualize real-time mempool composition and historical fee charts. Set up browser alerts or third-party notification services for mempool size thresholds and fee rate bands that matter to your trading strategy. The platform also offers downloadable CSV exports that can feed into external analysis tools.
For custom monitoring, Python scripts using the mempool.space API can pull JSON data on fee estimates and transaction counts. Schedule these scripts via cron jobs to log data every five minutes, then feed the results into simple visualization libraries like Matplotlib or Plotly. Basic scripts require only standard HTTP requests and JSON parsing, making them accessible even to traders with limited coding experience.
Next, cross-reference with bitcoin.org resources on protocol rules to understand how changes in block weight limits affect clearing rates. This foundational knowledge helps interpret why certain mempool sizes produce different fee outcomes over time.
Practical Examples from 2026 Volatility Events
During the March 2026 volatility spike, mempool size climbed above 300 MB while the 90th percentile fee rate jumped from 8 sat/vB to over 45 sat/vB within four hours. Traders who monitored this divergence adjusted position sizing ahead of the subsequent price reversal, avoiding unnecessary fees on large withdrawals. The event demonstrated how mempool depth can act as an early warning system for liquidity stress across exchanges.
A later June event showed mempool congestion decoupling from price action, highlighting the value of waiting for confirmation across multiple indicators before acting. In that case, a temporary influx of low-fee transactions cleared within two blocks, preventing the fee spike many had anticipated. These contrasting examples underscore the importance of context when interpreting raw mempool statistics.
Comparing Mempool Signals to Price Movements
Historical overlays reveal that sustained mempool growth frequently leads price corrections by 12-48 hours. Conversely, rapid mempool clearing often coincides with bullish momentum as transaction costs fall and network usability improves. Side-by-side charting of mempool depth versus BTC price has revealed repeatable lead-lag relationships that enhance timing precision for both short-term scalps and swing trades.
Traders who maintain these comparative views learn to recognize when mempool signals are being overridden by broader market sentiment. This comparative discipline prevents over-trading on isolated network metrics and encourages a more balanced, multi-factor approach to decision making.
Advanced Custom Scripting Techniques
Beyond basic logging, advanced users can implement real-time dashboards that aggregate mempool data with exchange order book snapshots. Using lightweight web frameworks, these dashboards can display live heatmaps of fee rates and highlight anomalies that warrant immediate attention. Storing historical snapshots in a simple database also enables backtesting of fee prediction rules against past volatility periods.
Common Mistakes to Avoid
- Over-relying on single snapshots without trend context
- Ignoring fee rate distribution across the entire mempool
- Failing to account for weekend or holiday liquidity differences
- Neglecting API rate limits when building custom dashboards
- Assuming all congestion leads to price impact without confirming on-chain volume
FAQ
How quickly can mempool data predict fee spikes?
Significant changes in mempool size and fee distribution often provide 30-90 minutes of lead time before retail fee estimators update, giving prepared traders an advantage in positioning.
Are free tools sufficient for professional analysis?
Yes, mempool.space combined with lightweight scripts delivers professional-grade visibility without subscription costs, although paid data providers can offer additional granularity for high-frequency strategies.
What indicates a false positive in mempool signals?
Isolated spikes without corresponding increases in active addresses or transaction volume usually represent temporary noise rather than structural demand.
Should traders adjust position sizes based solely on mempool data?
No, mempool analysis works best when combined with price action, volume, and macroeconomic context to avoid acting on incomplete information.
How often should custom scripts poll the mempool API?
Polling every five minutes strikes a balance between responsiveness and avoiding rate limits for most monitoring use cases.
Conclusion
Mastering Bitcoin mempool analysis equips 2026 traders with a data-driven edge for navigating fee environments and anticipating network stress. By combining congestion pattern recognition, refined estimation models, and on-chain confirmation, market participants can make more timely and informed decisions while minimizing unnecessary costs during volatile periods.

No comments yet. Be the first!