 CryptoChain Blog
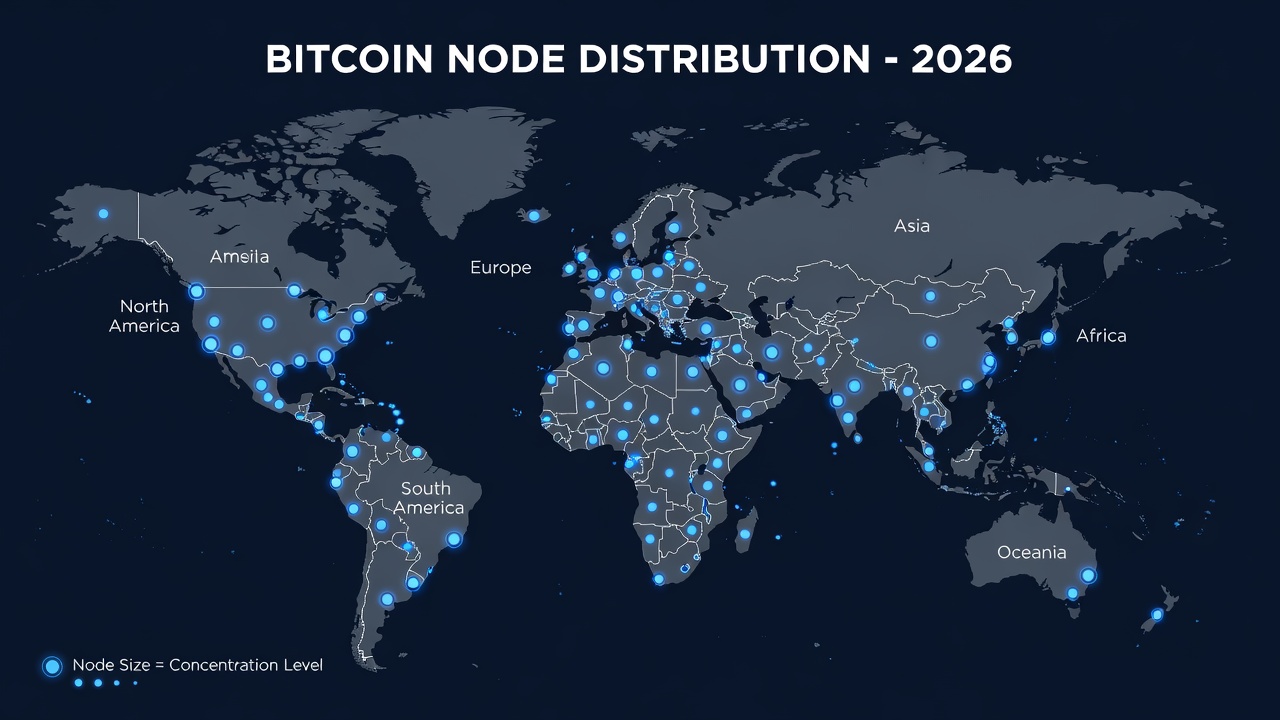
Introduction to Bitcoin Node Distribution in 2026
Bitcoin's resilience depends heavily on its decentralized network of nodes. In 2026, understanding global node distribution patterns is essential for assessing network health and identifying potential vulnerabilities. This analysis draws on current data to highlight how node geography, types, and uptime influence the network's ability to withstand attacks or regulatory pressures. As Bitcoin matures, node operators face evolving challenges from infrastructure limitations, energy costs, and shifting government policies around cryptocurrency participation.
Decentralization remains a core principle of Bitcoin, yet real-world factors like internet infrastructure and local regulations can create concentrations that threaten this ideal. Traders and analysts increasingly incorporate node metrics into market strategies to gauge sentiment and systemic risks. For example, sudden drops in reachable nodes from a particular region often precede broader market uncertainty, allowing proactive portfolio adjustments.
Key Data Sources for Tracking Bitcoin Nodes
Reliable tracking starts with established platforms that aggregate node information in real time. Bitnodes provides comprehensive snapshots of reachable nodes worldwide, including IP geolocation and version data. Another authoritative resource is the Bitcoin Core project documentation hosted at bitcoin.org, which details protocol requirements and node operation guidelines. Additional sources include public explorers that scrape the network continuously, such as those connected to the Bitcoin Core GitHub repository at bitcoincore.org.
These tools help users monitor changes over time rather than relying on single snapshots, revealing trends such as seasonal migrations or responses to geopolitical events. Advanced users can export raw datasets for custom analysis, enabling comparisons between current distribution and historical benchmarks from previous years.
Regional Concentration Risks and Their Implications
Node distribution often clusters in regions with strong internet connectivity and favorable regulations. Heavy concentration in a few countries increases risks from coordinated shutdowns or infrastructure failures. For instance, if a significant percentage of nodes reside in one jurisdiction, new laws could force operators offline, temporarily reducing network capacity and slowing transaction propagation during peak periods.
Analysts in 2026 note that diversification across continents strengthens resilience. Monitoring shifts away from high-risk areas helps predict potential forks or reduced hash rate correlations during crises. In practice, traders have observed that regions with unstable power grids show higher node churn rates, leading to temporary centralization spikes that affect overall network latency.
Tools for Visualizing Decentralization Metrics
Effective visualization turns raw data into actionable insights. Interactive maps from services like Bitnodes display node density by country, while dashboards from blockchain analytics firms overlay uptime and version statistics. Users can filter by node type to compare full nodes against pruned variants and identify emerging clusters in underserved regions.
These tools often include historical charts, allowing side-by-side comparisons of decentralization scores across years. Custom scripts using public APIs further enable traders to integrate metrics into their own monitoring systems, creating automated reports that flag deviations from established baselines.
Interpreting Node Uptime Statistics
Uptime data reveals operational reliability. Nodes with consistent availability contribute more to consensus and transaction relay. Low uptime in certain regions may signal unreliable power grids or ISP restrictions rather than deliberate exits. Traders should track 30-day rolling averages to distinguish temporary outages from structural issues, as sustained low uptime often correlates with broader adoption hurdles in emerging markets.
High-uptime clusters generally correlate with stronger network performance during volatility spikes. Practical interpretation involves layering uptime data with external factors such as local weather events or policy announcements to forecast potential disruptions before they impact trading volumes.
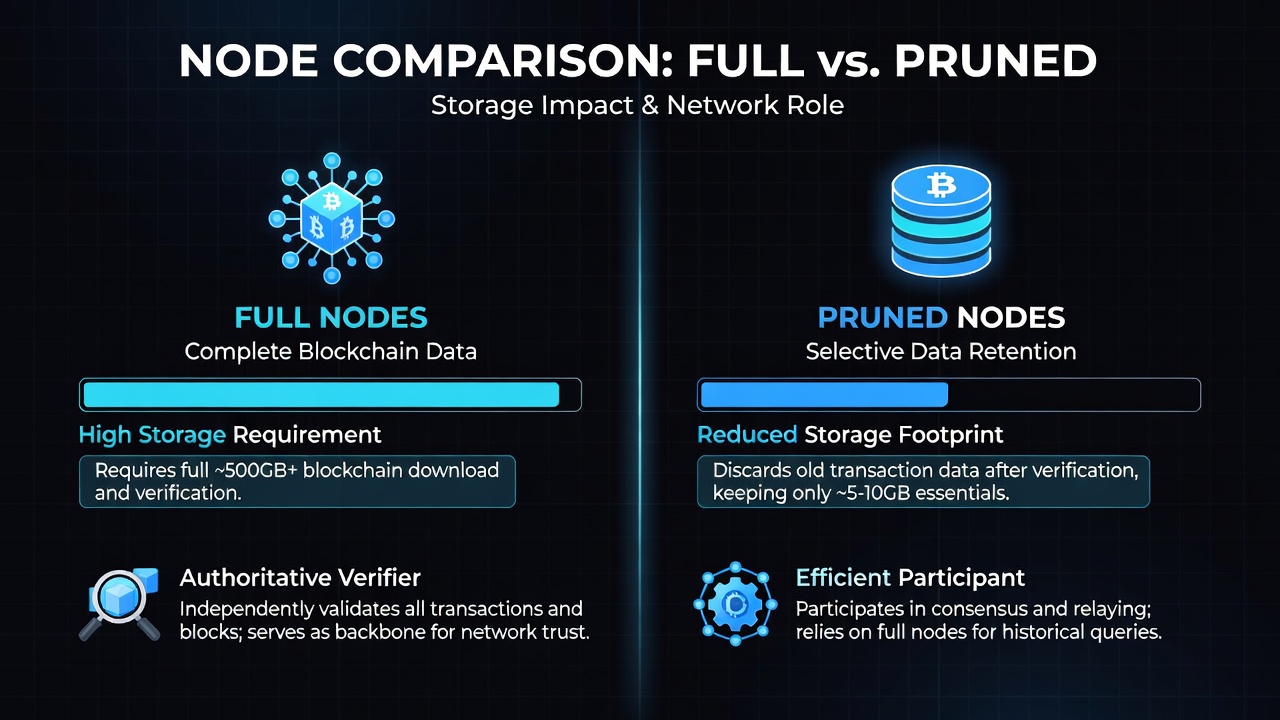
Full Nodes vs Pruned Nodes: Impacts on Decentralization
Full nodes store the entire blockchain history, providing maximum verification capability. Pruned nodes discard older blocks after validation, reducing storage needs while still participating in the network. Both types support decentralization, yet full nodes offer greater long-term archival value that proves critical during chain reorganizations or forensic analysis of past transactions.
In practice, pruned nodes lower barriers for home operators, increasing total node count and geographic spread. However, over-reliance on pruned setups can limit historical data availability during disputes. Operators should weigh hardware costs against the benefits of maintaining full archival copies, often starting with pruned configurations before upgrading as storage becomes more affordable.
Case Studies of Geographic Shifts
Recent patterns show gradual migration from traditional hubs toward emerging markets with improving connectivity. One notable shift involves operators relocating to regions with renewable energy sources, reducing operational costs and environmental concerns while enhancing network redundancy. Another case highlights how regulatory clarity in certain Asian and European countries has attracted node runners, balancing previous concentrations elsewhere.
These movements demonstrate the network's adaptability while underscoring the need for ongoing vigilance. A third example from Latin America illustrates how improved broadband access has boosted node counts, creating new resilient clusters that offset declines in saturated markets and provide traders with diversified signals for risk assessment.
Practical Steps for Traders to Incorporate Node Data
- Monitor daily node counts and geographic breakdowns via public dashboards to spot early warning signs of centralization, setting custom thresholds for alerts when regional shares exceed historical norms.
- Cross-reference uptime trends with price movements to identify periods when network stress may influence volatility, using simple spreadsheets to correlate metrics over monthly intervals.
- Use API feeds to build alerts for sudden drops in reachable nodes from specific continents, integrating these into existing trading bots for automated position sizing adjustments.
- Compare full versus pruned ratios quarterly to assess long-term archival health and decide whether to contribute additional full nodes in underrepresented areas.
- Combine node metrics with on-chain volume and hash rate data for a holistic market view, reviewing reports weekly to refine entry and exit strategies during uncertain periods.
FAQs on Common Misconceptions
Does a higher node count always mean better decentralization?
Not necessarily. Geographic spread and uptime matter more than raw numbers. Concentrated nodes in one area can still create single points of failure even with thousands of total nodes online.
Are pruned nodes less secure?
Pruned nodes validate the same rules as full nodes but store less history. They remain secure for transaction verification but cannot serve historical blocks to new peers, making them suitable for most individual users yet less ideal for archival purposes.
How often should traders check node distribution?
Weekly reviews suffice for most strategies, with deeper analysis during major network events or regulatory announcements that could trigger rapid shifts in operator behavior.
What hardware is typically needed to run a reliable node in 2026?
Modern setups often use compact devices with at least 2TB of storage for full nodes, reliable internet connections, and UPS backups to maintain uptime during short outages, allowing home operators to contribute meaningfully without enterprise-level infrastructure.
Conclusion
Bitcoin node distribution in 2026 continues to evolve, reflecting both technological progress and external pressures. By leveraging reliable data sources, visualization tools, and practical monitoring steps, traders and enthusiasts can better evaluate decentralization health and make informed decisions. Staying attentive to these metrics supports the long-term robustness of the Bitcoin network and helps participants navigate an increasingly complex global landscape.

No comments yet. Be the first!