 CryptoChain Blog

Introduction to Bitcoin Realized Cap in 2026
Bitcoin realized capitalization offers a powerful on-chain lens for understanding true holder conviction and market cycles. Unlike traditional market cap, realized cap reflects the aggregate value of coins at their last on-chain movement price. In 2026, this metric remains essential for decoding post-halving dynamics and spotting accumulation opportunities across volatile trading environments.
Traders and analysts use realized cap to distinguish between speculative froth and genuine long-term holding behavior. This guide examines calculation methods, historical patterns after the 2024 halving, and integration with complementary indicators such as SOPR and MVRV. By exploring holder behavior shifts, market bottoms, and risk management techniques, readers gain actionable insights for informed decision-making throughout the 2026 cycle.
How Realized Capitalization Is Calculated
Realized cap sums the USD value of every Bitcoin UTXO at the price when it last moved on-chain. This approach filters out lost coins and highlights economically active supply. Public dashboards from leading platforms allow users to visualize these data points without complex coding or proprietary software.
Step-by-step process begins with identifying all unspent transaction outputs and their last transfer block height. Next, assign each UTXO the closing price on that specific day using reliable price feeds. Finally, aggregate values across the entire supply to produce the realized cap figure. Analysts often compare this to market cap to derive the realized price, a key support level during corrections that helps define accumulation zones.
Understanding UTXO Fundamentals
Each Bitcoin transaction creates new UTXOs that carry forward the price at the moment of creation. This granular approach reveals spending patterns among different holder cohorts, from short-term traders to long-term investors. In 2026, tools make it straightforward to segment data by wallet age or entity type for deeper behavioral analysis.
Historical Patterns After the 2024 Halving
Following the April 2024 halving, realized cap showed slower growth compared to market cap during the initial euphoria phase. By mid-2025, holder behavior shifted toward accumulation as short-term holders capitulated, creating visible divergences. Case studies from the 2025-2026 cycle reveal that realized cap bottoms often preceded major rallies by 4-8 weeks, providing early warning signals for patient investors.
These patterns underscore how long-term holders anchored the metric during volatility, creating clearer signals than price alone. Comparing the 2024-2025 period to earlier cycles like 2020-2021 shows similar capitulation phases where realized cap stabilized while spot prices tested lows, often marking generational buying opportunities.
Comparing Realized Cap to Market Cap
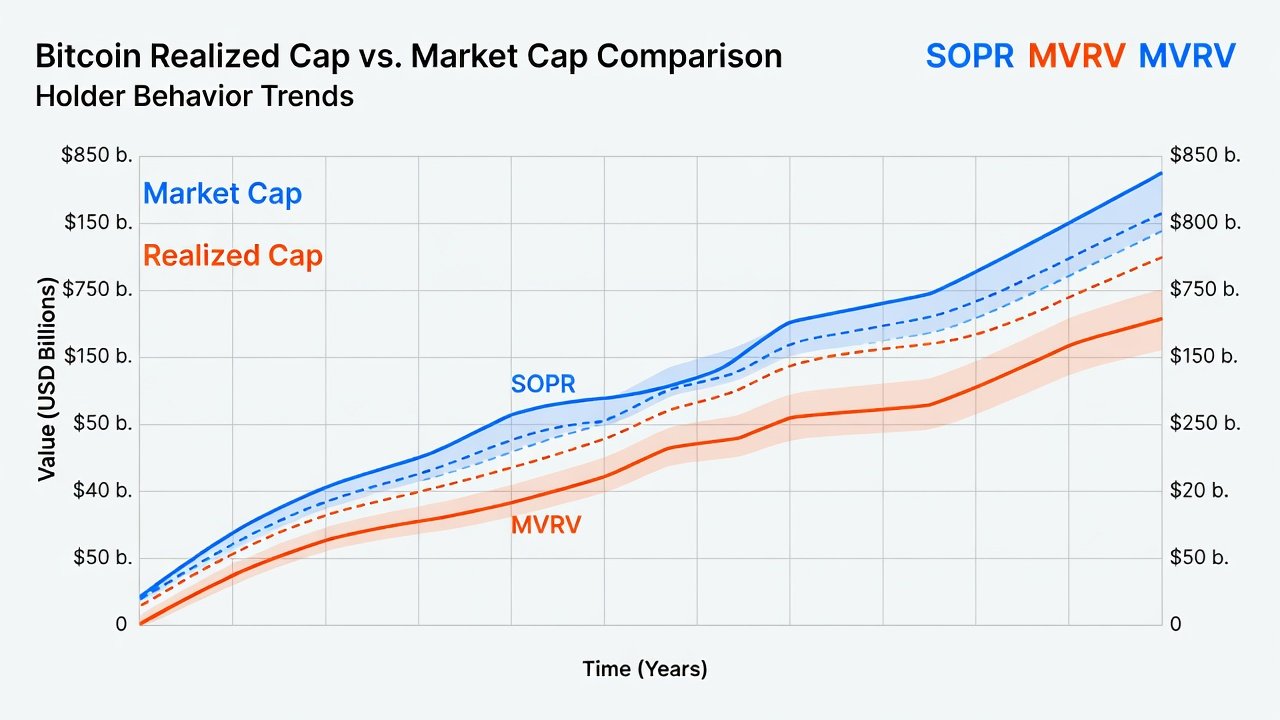
Market cap reflects current trading prices, while realized cap captures historical cost basis. The gap between them widens during bull markets and narrows at bottoms. In 2026, monitoring this divergence helps identify when speculative leverage dominates versus organic demand from committed holders.
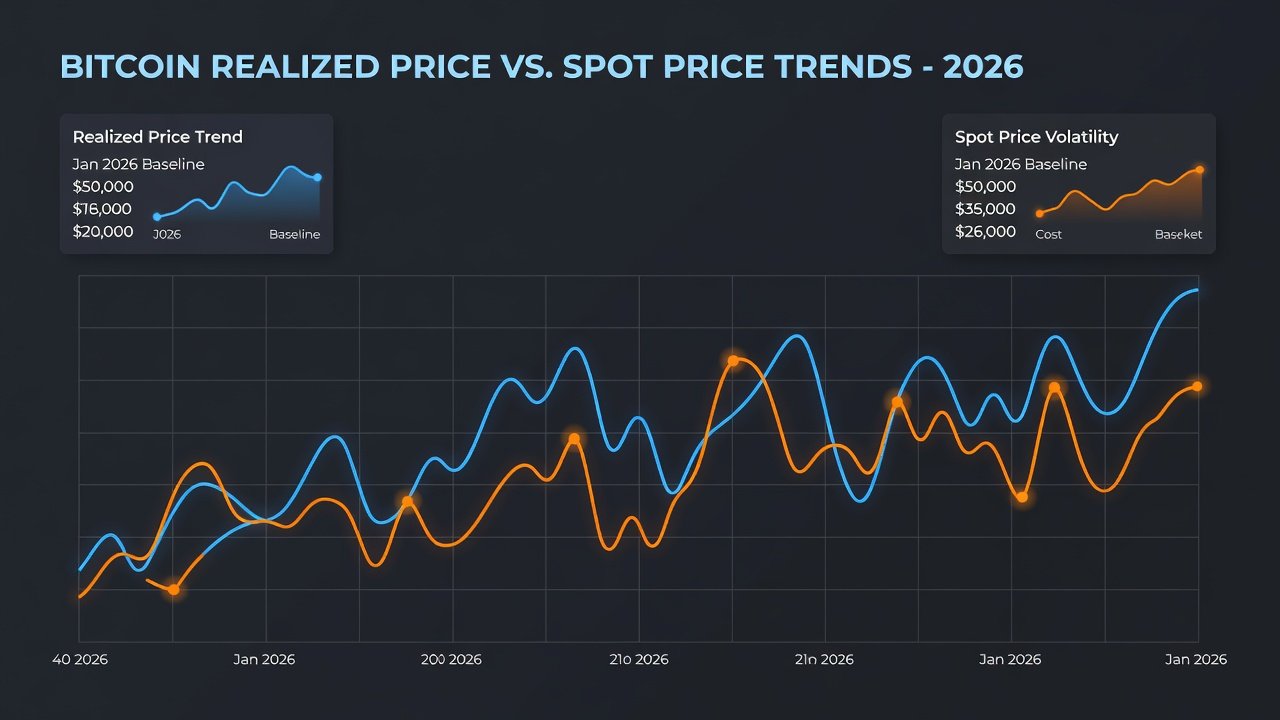
Realized price derived from this comparison acts as dynamic support. When market price approaches realized price from above, it frequently signals undervaluation relative to the average acquisition cost of active supply. This comparison proves especially useful when layered with volume trends and sentiment indicators.
Integrating SOPR and MVRV with Realized Cap
SOPR measures profit or loss realized on spent outputs, while MVRV compares market value to realized value. When combined with realized cap, these tools confirm market bottoms: low SOPR readings alongside contracting realized cap gaps often mark capitulation zones where weak hands exit.
Advanced analysts watch for MVRV Z-score reversals aligned with realized price support for high-probability entries. For instance, during 2025 drawdowns, SOPR dipping below 1.0 while realized cap held steady preceded strong rebounds. This multi-metric approach reduces false signals and improves timing for both beginners and experienced traders.
Step-by-Step Examples Using Public Dashboards
Access free tools from Glassnode to plot realized cap. Select the Bitcoin entity-adjusted realized price metric, overlay SOPR, and set date ranges from 2024 onward. Export CSV data for custom spreadsheet analysis of 2025-2026 holder cohorts, allowing users to backtest strategies against historical realized price levels.
Another reliable source is Coin Metrics, which provides transparent realized cap charts updated daily. Users can combine these with on-chain volume data to validate accumulation signals. A practical example involves loading the 2025 Q4 period, noting where realized cap flattened near $850 billion equivalents while price tested support, then confirming with SOPR recovery.
Case Studies of 2025-2026 Cycles
In late 2025, realized cap data highlighted a clear shift as long-term holders absorbed supply from exhausted short-term participants. This created a base that supported the early 2026 recovery. Analysts observed similar dynamics in prior post-halving years, where realized price served as a floor during macro-driven corrections.
These case studies demonstrate the value of tracking cohort behavior. Short-term holder realized cap often leads volatility, while long-term holder realized cap provides stability. Combining both views gives a complete picture of market psychology in 2026.
Practical Signals for Accumulation Zones and Risk Management
- Watch for realized cap flattening while price declines – classic accumulation signal indicating strong hands are buying dips.
- Set alerts when realized price acts as dynamic support, helping define entry points with favorable risk-reward ratios.
- Pair with on-chain volume spikes to confirm conviction and avoid low-liquidity traps.
- Use position sizing rules: limit exposure when realized cap diverges sharply upward from price, signaling potential overvaluation.
- Monitor weekly changes in realized cap growth rate to gauge overall holder commitment during uncertain periods.
Common Pitfalls in Data Interpretation
Beginners often confuse realized cap with total supply valuation or ignore lost coins that permanently reduce effective supply. Advanced users may overfit short-term noise without considering macroeconomic context such as interest rate shifts or regulatory developments. Always cross-reference multiple timeframes and avoid trading solely on one metric without confirming confluence from SOPR or MVRV.
Another frequent mistake involves misreading temporary spikes caused by large entity movements. Context from wallet clustering tools helps separate noise from meaningful trend changes.
FAQs on Realized Cap Analysis
How does realized cap differ from market cap? It reflects historical cost basis rather than current spot prices, offering a more stable view of holder economics.
Is realized cap useful for beginners? Yes, when viewed through simple dashboard visualizations that highlight key divergences and support levels.
Can it predict exact market bottoms? It provides probabilistic zones rather than precise timing, best used alongside other on-chain and technical indicators.
How often should traders review realized cap data? Weekly checks suffice for most strategies, with daily reviews during high-volatility periods in 2026.
Conclusion
Bitcoin realized cap remains a cornerstone metric for 2026 holder behavior analysis. By mastering its calculation, historical context after the 2024 halving, and integration with SOPR and MVRV, traders gain clearer insights into accumulation phases and risk management. Regular dashboard review using resources like Glassnode and Coin Metrics builds confidence across market cycles, empowering both novice and advanced analysts to navigate 2026 with data-driven precision.
No comments yet. Be the first!