 CryptoChain Blog

Introduction to Bitcoin UTXO Analysis in 2026
Bitcoin's Unspent Transaction Output (UTXO) model remains one of the most powerful on-chain frameworks for understanding holder behavior and market dynamics. As we move into 2026, traders and analysts are leveraging UTXO data to move beyond simple price charts and into behavioral insights that often precede major market shifts. This guide explores advanced strategies tailored for intermediate analysts seeking actionable intelligence that goes far deeper than basic metrics like exchange flows or simple transaction counts.
The UTXO set represents every unspent output from previous transactions, serving as a transparent ledger of Bitcoin's distribution across millions of addresses. By examining factors like age, size, and movement patterns, analysts can identify accumulation phases, detect distribution events, and correlate these with price action in ways that provide genuine edges. In 2026, with increased institutional participation and maturing market infrastructure, UTXO analysis has become even more nuanced, requiring careful consideration of custodial behaviors and protocol upgrades.
Understanding the UTXO Model Fundamentals
Unlike account-based models used by many altcoins, Bitcoin tracks ownership through UTXOs. Each UTXO carries metadata including its creation date, value, and spending conditions defined by script types such as P2PKH or Taproot outputs. Dormant UTXOs—those untouched for years—often signal long-term holder conviction and reduced circulating supply, while active UTXOs reflect short-term trading activity and potential volatility triggers.
Key metrics include UTXO age bands, which group outputs by their dormancy periods, and the realized price, derived from the average acquisition cost of all UTXOs. These provide context for market cycles that basic exchange data cannot reveal. For example, a sudden shift of large UTXOs from the 3-6 month band into younger cohorts can indicate profit-taking by mid-cycle accumulators, often coinciding with local price resistance levels observed in previous bull markets.
Practical Steps for Querying UTXO Sets
Accessing and analyzing the full UTXO set requires specialized tools and careful data handling. Start by connecting to a Bitcoin node or using public explorers that expose raw data. Query scripts can filter by age, value thresholds, or script types to isolate relevant cohorts.
- Run a full node synced to the current chain tip and use Bitcoin Core's RPC commands such as gettxoutsetinfo to export the complete UTXO set snapshot.
- Apply filters for outputs older than one year or five years to isolate long-term holders versus recent entrants.
- Aggregate data by address clusters using heuristics like common-input-ownership to achieve entity-level insights rather than raw address counts.
- Export results into CSV or JSON formats suitable for analysis platforms like Python-based notebooks.
- Incorporate additional metadata such as output script types to distinguish legacy addresses from modern Taproot ones prevalent in 2026.
- Validate your dataset against known network totals to ensure completeness before proceeding to visualization.
These steps enable precise segmentation of holder cohorts and their spending tendencies, forming the foundation for reliable pattern detection.
Identifying Accumulation Patterns
Accumulation often appears as clusters of UTXOs created during price dips without subsequent movement for extended periods. In 2026, watch for large-value UTXOs (typically over 10 BTC) entering long-term storage addresses during consolidation phases. Cross-reference these with exchange inflows to confirm whether coins are leaving trading venues into self-custody solutions.
Real-world examples from prior cycles show that sustained UTXO creation below the 200-day moving average frequently preceded rallies lasting several months. Analysts combine this with volume-weighted age metrics and cohort retention rates for higher conviction signals. A practical case involves monitoring whale wallets that consistently add to positions during weekly dips, creating distinct UTXO fingerprints that later correlate with breakout moves when broader sentiment improves.
Comparing Dormant vs Active UTXOs
Dormant UTXOs provide a baseline for illiquid supply, while active ones indicate liquidity available for trading. A rising ratio of dormant to active UTXOs typically correlates with reduced sell pressure and stronger holder bases.
- Dormant (over 1 year): Strong holder base with lower velocity, often representing entities with multi-year time horizons who rarely react to short-term news.
- Active (under 1 month): Speculative flows with higher sensitivity to news and macroeconomic events, frequently originating from trading desks or short-term speculators.
- Transition zones: UTXOs moving from dormant to active often mark local tops or bottoms as early holders begin to redistribute holdings.
Understanding these distinctions helps traders anticipate volatility spikes and adjust position sizing accordingly. In 2026 environments, the interplay between these groups has grown more complex due to layered custody solutions and institutional mandates.
Tools for Visualization and On-Chain Dashboards
Effective analysis relies on visual tools that transform raw data into interpretable charts. Platforms like Mempool.space offer real-time UTXO age distributions and historical comparisons. Combine these with clustering algorithms to track entity behavior over time and detect coordinated movements across multiple addresses.
Integration with custom dashboards allows overlaying UTXO metrics directly onto price charts, revealing divergences invisible in traditional technical analysis. Additional resources from Bitcoin.org provide foundational documentation on transaction structures that enhance interpretation of visualization outputs.
Linking UTXO Data to Price Movements
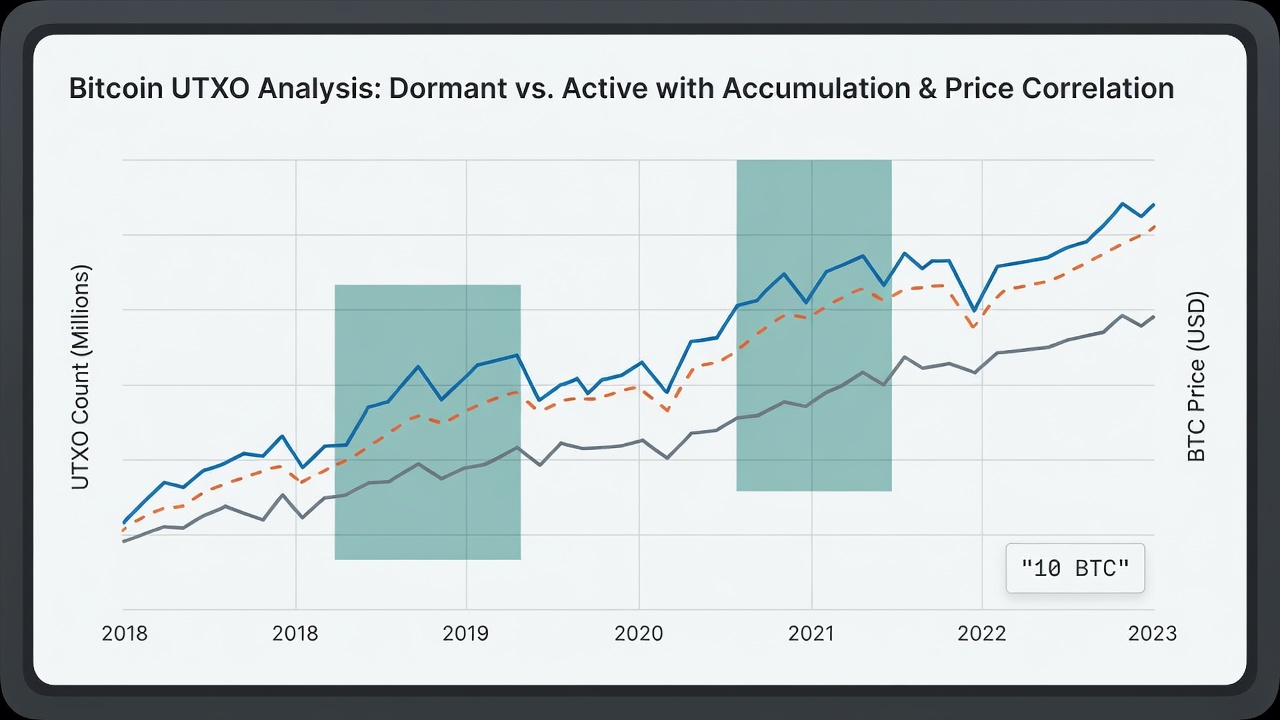
Historical patterns demonstrate clear correlations between UTXO dynamics and subsequent price action. For instance, sharp increases in young UTXOs during uptrends often signal distribution by early accumulators seeking to realize gains. Conversely, consolidation of older UTXOs during sideways markets has preceded breakouts as supply tightens.
Traders in 2026 use machine learning models trained on UTXO age bands and spending velocity to generate probability-weighted forecasts, improving entry timing beyond simple on-chain ratios. Combining these signals with broader macroeconomic indicators creates robust frameworks for multi-week position planning.
Step-by-Step Tutorial: Building Your First UTXO Analysis
Follow this workflow to start applying these strategies immediately and scale them into ongoing monitoring routines:
- Download a recent UTXO snapshot from a trusted node or public archive and verify its hash against the current blockchain state.
- Parse the JSON output using Python scripts to group outputs by predefined age bands such as 1 day, 1 week, 1 month, 6 months, and 1+ years.
- Calculate percentages of total supply held in each band and track changes week-over-week to spot emerging trends.
- Plot trends against Bitcoin's price using libraries like Matplotlib or Plotly, adding annotations for major news events that may have influenced spending.
- Backtest signals against 2024-2025 data for validation, focusing on false positive rates during ranging markets.
- Monitor live updates weekly by automating node queries and integrate alerts for significant shifts in dormant supply percentages.
- Refine models by incorporating additional variables such as fee rates paid by spending UTXOs to gauge urgency of movements.
This process transforms raw blockchain data into trading decisions that can be iterated and improved over multiple market cycles.
Common Pitfalls and Mistakes to Avoid in 2026 Data Interpretation
Many analysts encounter challenges when interpreting UTXO data in the current environment. Overlooking exchange cold wallet movements can inflate perceived active supply, while ignoring Taproot adoption rates may lead to incomplete clustering. Always cross-verify datasets with multiple sources and maintain awareness of protocol changes that affect output visibility.
FAQ
How do exchange UTXOs affect analysis? Exchange-held coins often appear active but represent custodial holdings, skewing liquidity readings. Always adjust for known cold wallets using public attribution data.
Can UTXO analysis predict exact price levels? No single metric offers precision; combine with macroeconomic factors, order book depth, and sentiment indicators for robust signals.
What about privacy tools like CoinJoin? These mix UTXOs and can obscure ownership trails, requiring careful clustering techniques and probabilistic modeling to avoid false signals.
Is historical data still relevant in 2026? Market maturity has altered some patterns, so recalibrate models using the most recent 18 months of on-chain activity alongside older cycle comparisons.
How frequently should UTXO snapshots be updated? Weekly snapshots suffice for most trend analysis, though daily monitoring becomes valuable during high-volatility periods or around major network events.
Conclusion
Bitcoin UTXO analysis equips 2026 traders with a granular view of supply dynamics that complements price action and sentiment data. By mastering querying techniques, pattern recognition, dashboard integration, and careful avoidance of common interpretation errors, analysts gain an edge in anticipating shifts driven by holder behavior. Consistent application of these strategies transforms raw blockchain data into a competitive advantage that supports more informed position management across varying market conditions.

No comments yet. Be the first!