 CryptoChain Blog
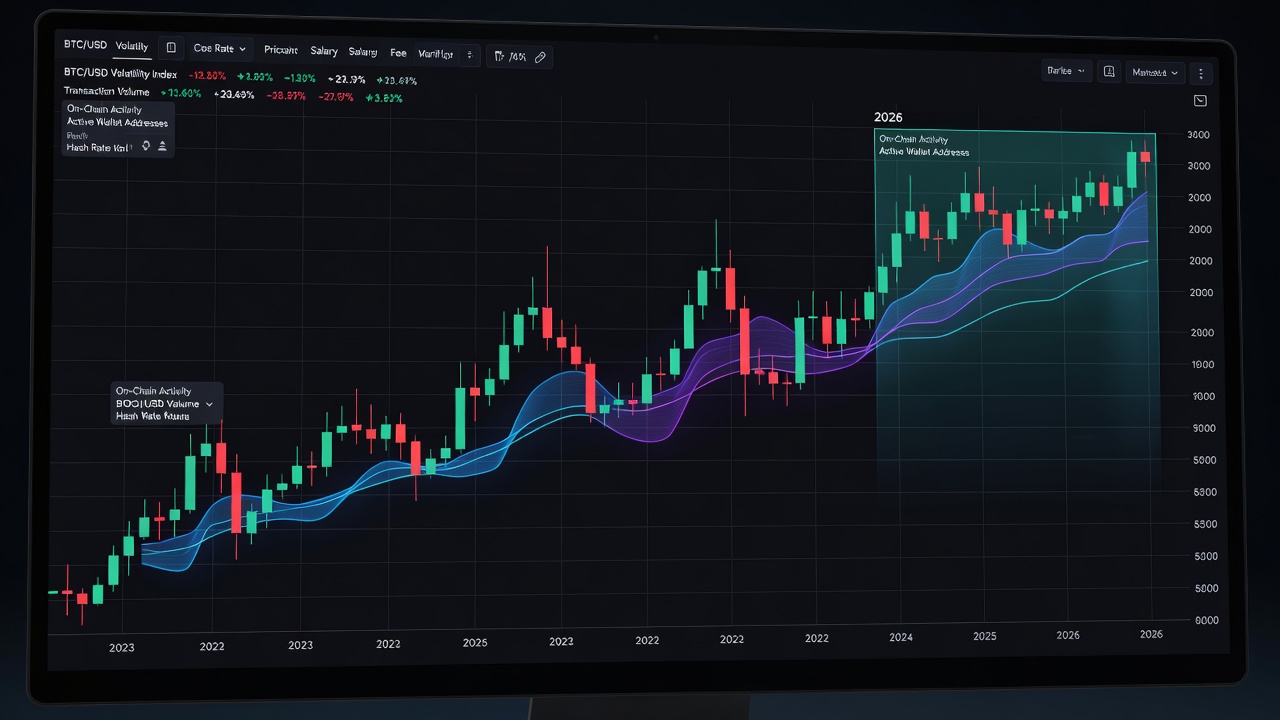
Introduction to Bitcoin Volatility Forecasting in 2026
Bitcoin volatility forecasting has become essential for traders navigating the evolving crypto landscape. In 2026, sophisticated methods combine on-chain analytics with traditional market indicators to provide actionable insights beyond simple price trends. This guide explores practical techniques using historical patterns, tools like Average True Range (ATR) and options-implied volatility, and news sentiment analysis. Traders seeking deeper BTC analysis will find step-by-step model-building examples and cycle comparisons here. Effective forecasting supports better risk management in volatile conditions by allowing positions to be sized appropriately and hedges to be deployed proactively.
Understanding volatility goes far beyond basic trend following. It involves quantifying expected price swings to protect capital during periods of rapid movement. As institutional participation grows, forecasting models must account for new variables such as ETF inflows and regulatory developments that influence liquidity.
Historical Volatility Patterns in Bitcoin
Bitcoin's price history reveals recurring volatility clusters tied to halvings, regulatory events, and macroeconomic shifts. Analyzing past cycles from 2013 through 2024 shows that volatility often spikes 30-60 days after major halvings before stabilizing. In 2026, similar patterns may emerge following the 2024 halving's maturation phase. Key metrics include realized volatility calculated over 30- and 90-day windows. These patterns help contextualize current market behavior and anticipate potential regime shifts.
Early cycles featured extreme swings exceeding 100 percent annualized volatility, while later cycles moderated as market capitalization increased. However, sharp drawdowns remain common during periods of leverage unwinding. Traders can map these historical regimes against on-chain activity such as dormant coin movement to improve timing. Bitcoin's foundational documentation provides useful context on protocol changes that historically preceded volatility events.
Tools for Measuring and Forecasting Volatility
Practical forecasting relies on established indicators. Average True Range (ATR) measures market volatility by averaging true range values over a chosen period, typically 14 days. Options-implied volatility, derived from BTC options pricing, reflects market expectations of future swings. Combining these with on-chain data such as exchange inflows and active addresses enhances predictive power.
Additional tools include Bollinger Band width for visualizing contraction and expansion phases, as well as the Volatility Index equivalents adapted for crypto markets. On-chain metrics from sources like realized cap and transaction volume add fundamental layers that pure price-based tools miss. 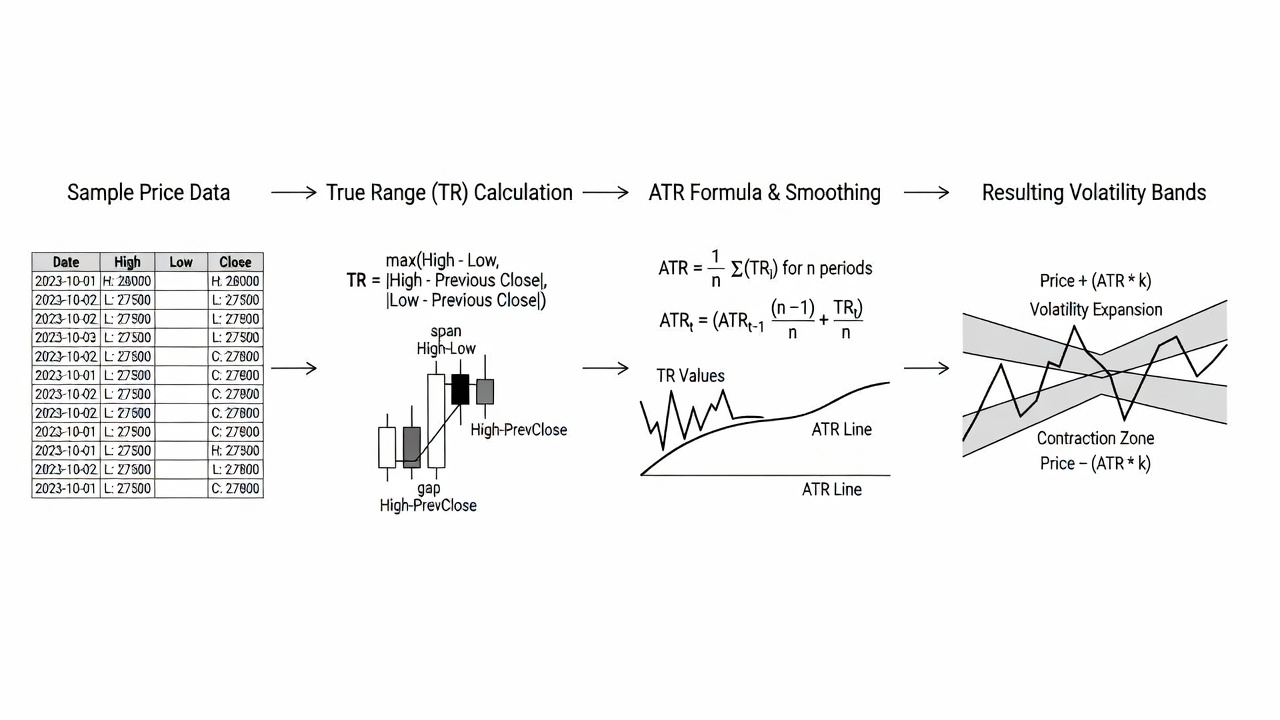
Step-by-Step: Building a Simple ATR-Based Forecasting Model
- Collect daily high-low-close data for BTC over the past 90 days from reliable exchanges.
- Calculate true range for each day using the formula: max(high-low, abs(high-prev close), abs(low-prev close)).
- Compute 14-day ATR as the exponential moving average of true ranges to smooth noise.
- Project future volatility bands by multiplying ATR by a factor such as 2.0 and adding or subtracting from current price.
- Backtest against historical outcomes to refine parameters and avoid overfitting.
- Integrate filters such as volume thresholds to reduce false signals during low-liquidity periods.
This model can be implemented in Python using libraries like pandas and TA-Lib for rapid iteration. A practical example involves running the model daily and generating alerts when projected bands exceed recent realized ranges by 25 percent.
Integrating BTC News Sentiment Analysis
News sentiment significantly influences short-term volatility. In 2026, natural language processing tools scan headlines and social media for positive or negative tones. High negative sentiment often precedes volatility spikes. Traders can aggregate sentiment scores from multiple sources and correlate them with on-chain metrics. For example, sudden negative news combined with rising exchange deposits signals potential downside volatility that technical indicators alone may not capture immediately.
Advanced implementations use weighted sentiment scores adjusted for source credibility. Combining these signals with ATR readings creates a composite volatility forecast that improves responsiveness to event-driven moves.
Comparing Forecasting Methods to Past Cycles
Methods effective in 2017 and 2021 cycles remain relevant but require updates for institutional participation and ETF flows. Implied volatility from options markets now provides earlier signals than pure on-chain analysis alone. Backtesting shows hybrid models outperform single-indicator approaches by meaningful margins during turbulent periods. The 2022 bear market highlighted the value of incorporating macroeconomic data, as Federal Reserve policy announcements amplified Bitcoin moves more than in prior cycles. Official economic releases remain critical inputs for 2026 models.
Mistakes to Avoid When Building Volatility Models
- Over-reliance on a single indicator without cross-validation leads to frequent false positives.
- Ignoring regime shifts after major events such as ETF approvals can render historical parameters obsolete.
- Failing to account for weekend gaps and low-liquidity sessions distorts ATR calculations.
- Neglecting transaction costs in backtests produces overly optimistic performance estimates.
Applying Forecasts to Risk Management
Volatility forecasts directly inform position sizing and stop-loss placement. When forecasted ATR rises above historical averages, reduce exposure by meaningful percentages. Use implied volatility levels to set dynamic options hedges. A concrete example involves scaling position size inversely to expected volatility while maintaining a maximum portfolio risk of 1-2 percent per trade. This approach proved effective during the 2024-2025 transition period when volatility regimes shifted rapidly.
Regular model recalibration using rolling windows prevents degradation as market structure evolves. Traders should also maintain a dashboard tracking multiple volatility measures simultaneously for confirmation before acting on any single signal.
Conclusion
Bitcoin volatility forecasting in 2026 demands a multi-layered approach that blends historical context, technical tools, on-chain data, and sentiment analysis. By following the structured methods outlined above, traders can develop more reliable expectations of price swings and apply them directly to position management. Continuous refinement through backtesting and real-world application remains the key to staying ahead of market dynamics.
FAQ
How accurate are Bitcoin volatility forecasts for 2026?
Forecasts improve with hybrid models but remain probabilistic. Accuracy depends on incorporating real-time on-chain and sentiment data alongside traditional indicators for the best results.
Which tools are best for beginners?
Start with ATR and free charting platforms before advancing to options data and custom scripts. This progression builds foundational understanding before adding complexity.
Can sentiment analysis replace technical indicators?
No, it works best as a complementary layer to ATR and implied volatility for robust results rather than a standalone solution.
How should traders adjust positions based on forecasts?
Scale position sizes inversely with expected volatility and maintain strict risk limits per trade to preserve capital during high-volatility episodes.
What data sources provide reliable on-chain metrics?
Reputable providers aggregate exchange flows, active addresses, and realized capitalization to supplement price-based forecasts effectively.

No comments yet. Be the first!