 CryptoChain Blog

Introduction to Custom Bitcoin Indicators
In 2026, traders seeking an edge in Bitcoin markets are moving beyond generic metrics like moving averages or RSI. Custom indicators allow for tailored analysis using on-chain data and market signals specific to BTC behavior. This tutorial provides actionable workflows for sourcing reliable data, scripting in Python, and implementing backtesting and visualization to refine your strategies. By creating bespoke tools, you gain deeper insights into network health, liquidity flows, and volatility patterns that off-the-shelf solutions often overlook. The focus remains on practical implementation without duplicating standard trend guides. Custom indicators empower traders to capture nuances such as miner capitulation signals or exchange reserve anomalies that evolve with Bitcoin's maturing ecosystem. Over the following sections, we will break down each component of the workflow with concrete examples and decision frameworks to ensure your implementations deliver measurable improvements in analytical precision.
Sourcing Reliable On-Chain and Market Data APIs
High-quality data forms the foundation of any custom indicator. Start with established providers offering Bitcoin-specific endpoints for metrics such as hash rate, transaction volume, and exchange flows. Reputable options include public APIs from blockchain explorers and analytics platforms that deliver real-time and historical datasets. Key considerations include API rate limits, data granularity, and authentication methods. Always verify endpoint stability and cross-reference multiple sources to minimize discrepancies. For example, integrate feeds from bitcoin.org resources alongside commercial providers for comprehensive coverage. When selecting APIs, prioritize those with documented schemas for fields like block height, mempool size, and UTXO distribution. Many platforms now support WebSocket connections for streaming updates, which reduces latency compared to polling methods. Test data freshness by comparing timestamps across providers during high-volatility periods. Document your data pipeline with version control to track changes in API responses over time, ensuring reproducibility of your indicators. Additionally, consider privacy implications when handling wallet-related data and always comply with applicable regulations regarding financial information.
Selecting Python Libraries for Custom Scripting
Python remains the preferred language due to its extensive ecosystem for data analysis. Essential libraries include pandas for data manipulation, numpy for numerical computations, and matplotlib or plotly for initial plotting. For on-chain processing, requests handles API calls efficiently while ccxt supports exchange data integration. Advanced users may incorporate backtesting frameworks like backtrader or vectorbt to simulate strategies. Ensure your environment uses Python 3.10 or later for optimal compatibility with 2026 library versions. When building your stack, evaluate performance trade-offs; for instance, polars offers faster DataFrame operations than pandas for large datasets exceeding one million rows. Install dependencies in isolated virtual environments using tools like poetry or pipenv to avoid conflicts. For API authentication, leverage libraries such as python-dotenv to manage secrets securely. Explore specialized Bitcoin libraries like bitcoinlib for address parsing and transaction decoding if your indicators require raw blockchain parsing. Regular updates to these libraries are essential, as 2026 releases often include improved handling of SegWit and Taproot data structures.
Step-by-Step Indicator Creation with Code Examples
Begin by fetching raw data via API and storing it in a pandas DataFrame. Next, define your custom logic—for instance, a Bitcoin-specific volatility-adjusted on-chain momentum indicator that combines transaction count with price deviation. Here is a simplified example structure that you can extend:
import pandas as pd
import requests

def fetch_btc_data(api_key):
    url = "https://api.example.com/btc/metrics"
    response = requests.get(url, headers={"Authorization": api_key})
    data = response.json()
    return pd.DataFrame(data)

def custom_btc_indicator(df):
    df['tx_momentum'] = df['tx_count'].pct_change(periods=7)
    df['volatility'] = df['price'].rolling(window=14).std()
    df['custom_signal'] = df['tx_momentum'] * (1 / df['volatility'])
    return df
Expand this by adding parameters for lookback periods and normalization techniques to suit different market regimes. After defining the function, apply it to historical data spanning multiple halvings to observe behavior across bull and bear cycles. Add error handling for missing values using forward-fill or interpolation methods appropriate for time-series data. Validate intermediate outputs by printing summary statistics at each transformation step to catch anomalies early in development.
Backtesting Methods for Robust Validation
Once built, rigorously test indicators using historical data splits. Employ walk-forward optimization and out-of-sample testing to avoid overfitting. Measure performance via metrics like Sharpe ratio, maximum drawdown, and win rate across multiple Bitcoin cycles. Document assumptions clearly, including transaction costs and slippage, to ensure realistic results. This step separates viable indicators from those that fail under live conditions. Begin with a simple buy-and-hold benchmark, then layer your custom signal to quantify incremental alpha. Use cross-validation techniques such as purged k-fold to respect temporal dependencies in price data. Incorporate Monte Carlo simulations to stress-test against randomized market scenarios. Track key performance indicators in a structured log file for later analysis and comparison across indicator iterations.
Visualization Techniques for Clear Insights
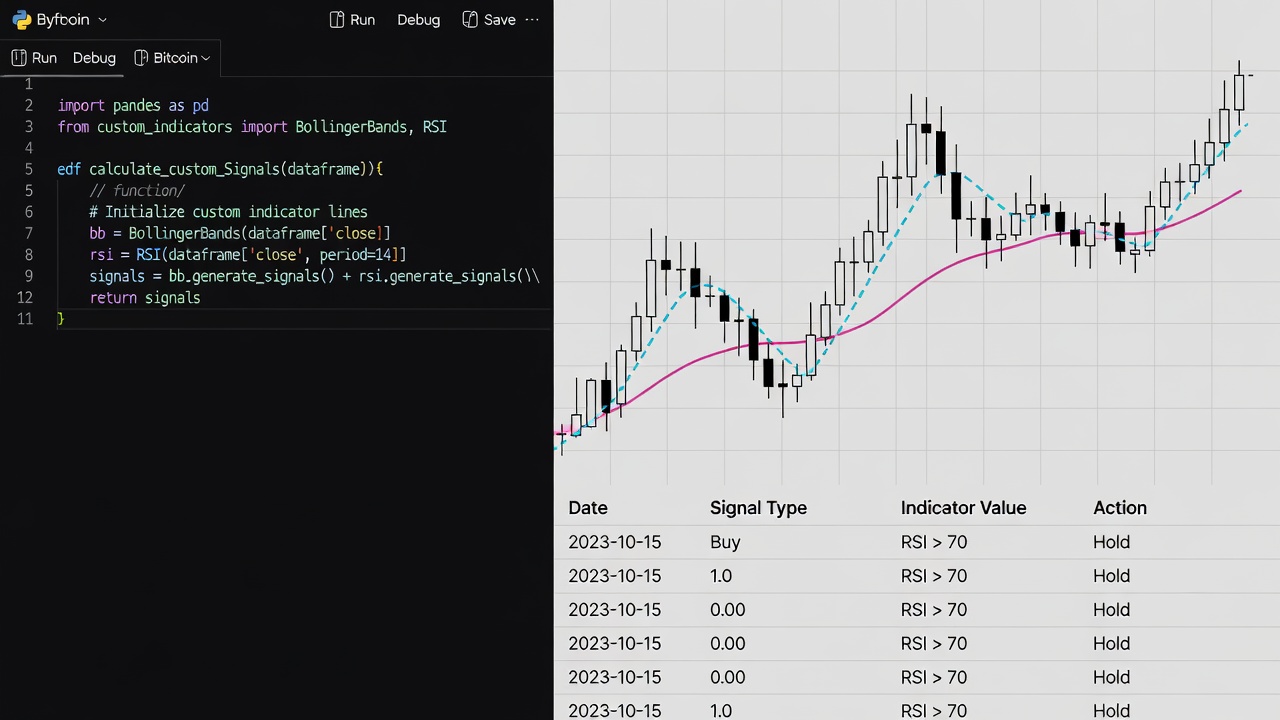
Effective visualization transforms raw outputs into actionable intelligence. Use interactive libraries like Plotly to overlay custom indicators on price charts, highlighting divergences or confluence zones. Add heatmaps for multi-timeframe analysis and export options for reporting. Layer annotations for key events such as halving periods or regulatory announcements to contextualize indicator behavior. Customize color schemes to differentiate signal strength and include tooltips that display exact calculation parameters when hovering over data points. Generate automated PDF reports using libraries like reportlab to summarize weekly indicator performance for team reviews or personal records. Experiment with candlestick overlays and volume profiles to reveal hidden correlations between on-chain activity and price action.
Comparing Custom vs Off-the-Shelf Tools in 2026
Off-the-shelf platforms offer convenience and community validation but often lag in specificity for niche Bitcoin signals. Custom builds provide full control and adaptability, though they require ongoing maintenance. In 2026, hybrid approaches—starting with open-source templates then extending them—strike an effective balance for most traders. Evaluate based on your technical comfort and analysis frequency. Custom solutions excel when you need proprietary combinations of metrics unavailable elsewhere, while commercial tools provide polished interfaces and pre-built alerts. Consider total cost of ownership including development time versus subscription fees when deciding between paths. Many traders maintain a core set of custom indicators while supplementing with established dashboards for redundancy.
Common Pitfalls to Avoid
- Overfitting to past data without forward validation
- Ignoring API latency and data quality issues
- Neglecting risk management integration
- Failing to update indicators as Bitcoin network dynamics evolve
- Underestimating the impact of exchange-specific data biases
- Skipping robustness checks during low-liquidity periods
FAQ: Integration Challenges and Solutions
How do I handle API authentication securely?
Store keys in environment variables and rotate them regularly to prevent exposure. Implement rate-limiting logic within your scripts to respect provider guidelines and avoid temporary bans.
What if data from different sources conflicts?
Implement reconciliation scripts that average or flag outliers before indicator calculation. Maintain a metadata table tracking source reliability scores based on historical accuracy.
Can these indicators integrate with trading bots?
Yes, expose outputs via simple REST endpoints or WebSocket streams for seamless automation. Use frameworks like FastAPI to serve indicator values with minimal overhead.
How frequently should indicators be recalibrated?
Review performance monthly and recalibrate parameters quarterly or after major network events such as difficulty adjustments.
Conclusion
Building custom Bitcoin indicators equips traders with precise, 2026-relevant tools for superior market understanding. Follow the workflows outlined to develop, test, and deploy solutions that genuinely enhance your BTC analysis capabilities. Continuous refinement based on live results will ensure your indicators remain relevant as the Bitcoin landscape continues to mature.


No comments yet. Be the first!