 CryptoChain Blog
Introduction to Bitcoin Chart Patterns in 2026
Bitcoin trading in 2026 demands sophisticated technical analysis as market volatility persists amid evolving regulatory and macroeconomic landscapes. Mastering chart patterns such as flags, triangles, and head-and-shoulders provides traders with actionable insights beyond basic price metrics. This guide delivers practical methods for identifying these formations, integrating them with on-chain data, and applying robust risk management during turbulent periods. Traders seeking an edge will benefit from comparing historical success rates to projected 2026 scenarios. By understanding market psychology embedded in price action, you can make more informed daily decisions in the Bitcoin ecosystem.
The maturation of Bitcoin as an institutional asset class has introduced new dynamics. Algorithmic trading, ETF flows, and global liquidity shifts now influence how patterns develop and resolve. This article goes beyond surface-level descriptions to equip you with concrete workflows that combine classic technical analysis with modern data sources.
Understanding Key Bitcoin Chart Patterns
Chart patterns reveal market psychology through price action. In 2026, Bitcoin's maturation as an asset class amplifies the reliability of classic formations when combined with volume and momentum indicators. Each pattern carries specific implications for continuation or reversal, but success depends on context such as overall trend strength and external catalysts.
Flags and Pennants
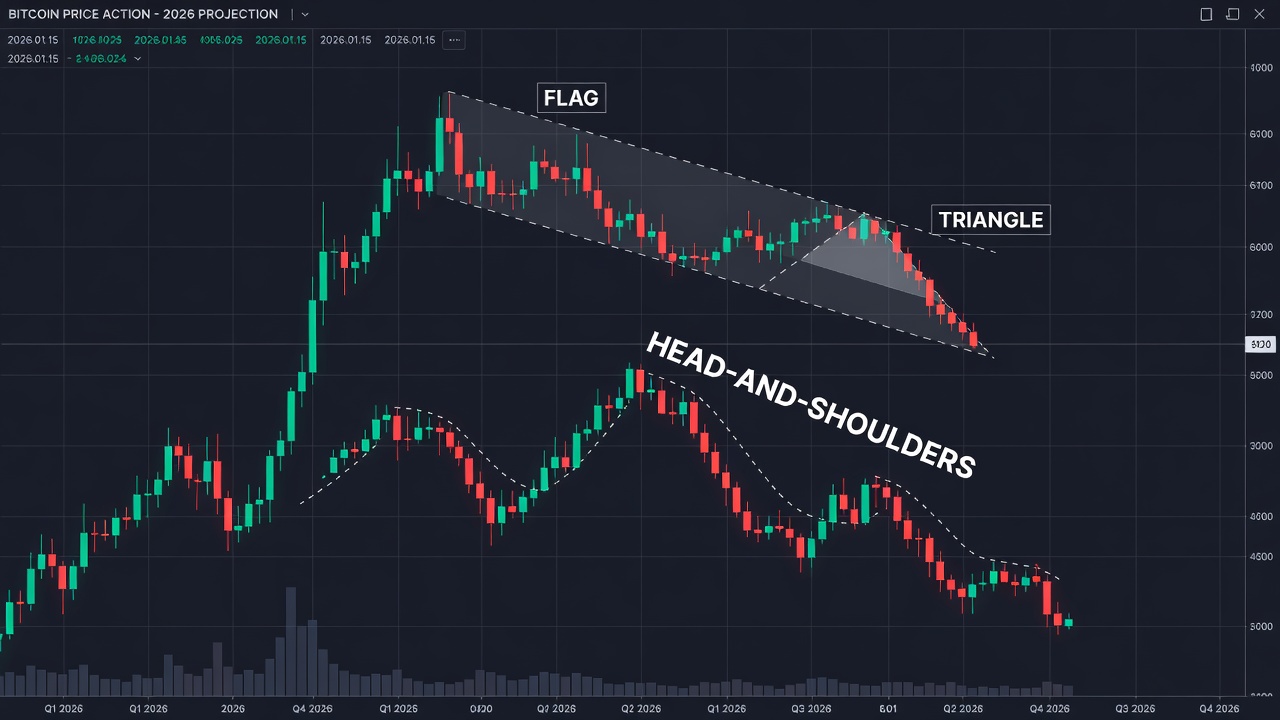
Flags represent brief consolidation after sharp moves. Bullish flags slope downward in an uptrend, signaling continuation. Identification starts with spotting a strong impulse wave followed by parallel trendlines. In 2026 conditions, these patterns often form around ETF inflow announcements or halving cycle echoes. For example, a post-halving rally might pause in a flag before resuming higher, offering traders a low-risk entry on the breakout. Bearish flags operate similarly in downtrends, with upward-sloping consolidations preceding further declines.
Triangles: Ascending, Descending, and Symmetrical
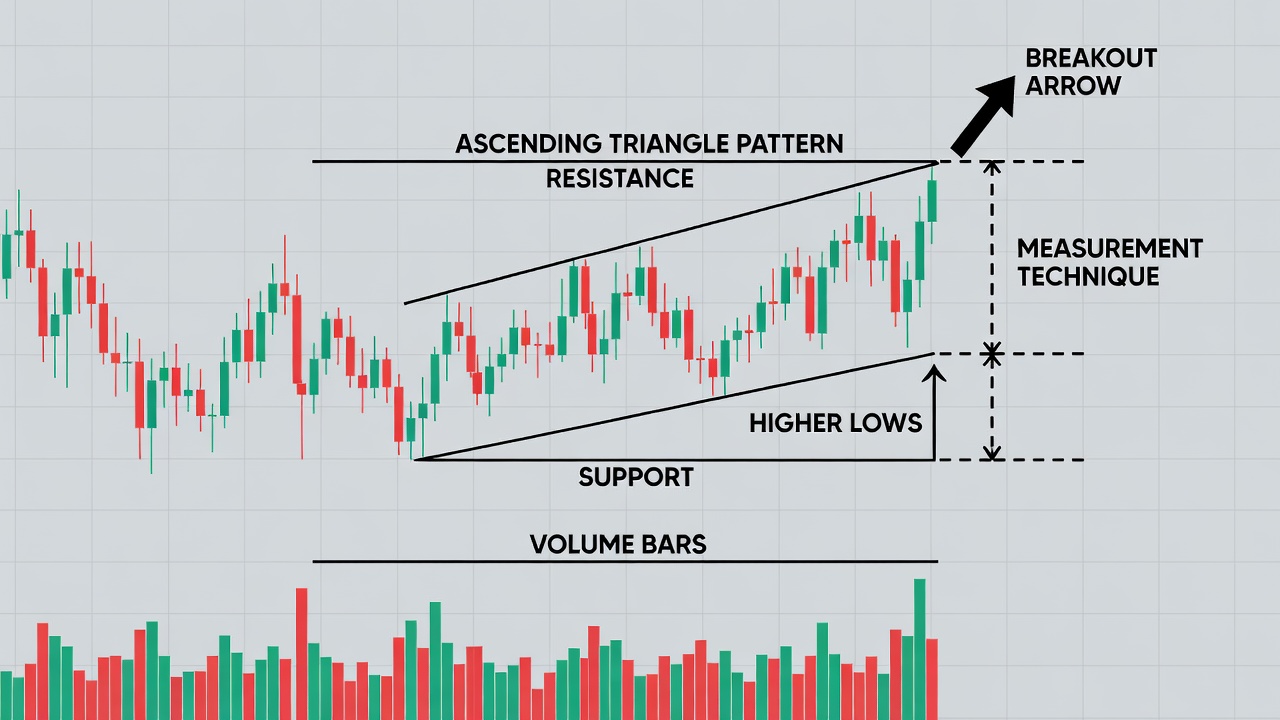
Triangles indicate building tension before breakout. Ascending triangles feature flat resistance with rising lows, favoring bulls. Step-by-step: Measure the base width for price targets, confirm with rising volume on breakout. Historical data shows strong continuation tendencies in BTC triangles during bull phases. Descending triangles mirror this with flat support and falling highs, often leading to breakdowns. Symmetrical triangles are neutral until resolution, requiring additional confirmation from momentum oscillators. In 2026, these formations may last longer due to increased market depth from institutional participants.
Head-and-Shoulders Formations
This reversal pattern signals trend exhaustion. The head peaks higher than shoulders, with a neckline connecting lows. For 2026 projections, inverted head-and-shoulders may appear during recovery rallies from regulatory dips. Traders should watch for volume spikes on the breakout and measure the projected move by adding the pattern height to the neckline. Real-world application includes monitoring how macroeconomic events, such as interest rate decisions, influence the formation of these structures.
Step-by-Step Identification Methods
Accurate identification requires discipline and multi-timeframe analysis. Begin by scanning daily and 4-hour charts for clear swing highs and lows that define the pattern boundaries. Draw trendlines meticulously to validate symmetry and convergence points. Next, incorporate confirming indicators such as RSI divergence or MACD crossovers to filter false signals. Wait for a decisive candle close beyond the breakout level rather than anticipating the move. Finally, project targets using the pattern height measured from the initial impulse. This methodical approach reduces emotional decision-making and improves consistency across volatile periods.
Integrating On-Chain Data with Technical Patterns
Combine chart analysis with metrics like exchange inflows, active addresses, and realized price to gain higher conviction. For instance, a triangle breakout accompanied by declining exchange reserves strengthens the bullish case because it signals reduced selling pressure. Rising active addresses during a flag consolidation often precedes strong continuation. Resources from bitcoin.org provide foundational blockchain insights that complement these techniques. Advanced traders also monitor hash rate trends and miner behavior to anticipate shifts that align with pattern resolutions. This fusion of on-chain and technical signals creates a more robust framework than relying on price action alone.
Risk Management Strategies for Volatile 2026 Markets
Position sizing remains critical—never risk more than 1-2% of capital per trade regardless of pattern strength. Place stop-losses below pattern invalidation points to protect against failed breakouts. During high-volatility windows, such as periods surrounding major central bank announcements, widen stops temporarily or reduce exposure entirely. Maintain a minimum risk-reward ratio of 1:2 to ensure long-term profitability. Additional tactics include scaling out of positions at partial targets and using options for hedging when patterns form near key psychological levels. Always document each trade with screenshots of the pattern and supporting data for later review.
Historical Success Rates vs. 2026 Projections
Past cycles show flags succeeding around 65% of the time in trending markets. Triangles have demonstrated even higher reliability in strong directional environments. In 2026, with increased institutional participation, expect similar or slightly improved outcomes for these patterns due to algorithmic reinforcement of breakouts. However, regulatory surprises or macroeconomic shocks can distort typical resolutions. Adjust expectations by cross-referencing broader sentiment indicators and maintaining flexibility in position sizing. Comparing 2021-2024 data with forward-looking models suggests that confluence with on-chain metrics will become even more decisive in the coming year.
Beginner-to-Advanced Workflow for Daily Trading
- Beginners should focus on one timeframe and master flag identification first through repeated chart review and paper trading.
- Intermediate traders layer on-chain confirmations and backtest patterns over at least 100 historical instances to build statistical confidence.
- Advanced practitioners automate alerts for pattern breakouts using scripting tools and correlate signals with global liquidity flows and macroeconomic calendars.
Progression through these levels involves consistent journaling and periodic strategy refinement based on live market feedback.
Common Pitfalls and Expanded FAQs
Many traders fail by forcing patterns onto noisy charts or ignoring volume confirmation. Overtrading during low-liquidity hours and neglecting wider market context also lead to losses. Always seek multiple points of confluence before entering.
FAQ 1: How reliable are these patterns in sideways markets?
They perform poorly without clear trends; wait for directional bias to emerge before acting on any formation.
FAQ 2: Should I use multiple timeframes?
Yes—confirm higher-timeframe patterns before executing on lower ones to avoid counter-trend traps.
FAQ 3: What tools help with real-time annotation?
Platforms offering drawing features allow precise markup of triangles and shoulders for ongoing review and backtesting.
FAQ 4: How do news events affect pattern validity?
Major announcements can invalidate patterns mid-formation; maintain awareness of the economic calendar and reduce position size accordingly.
Further reference material is available at investopedia.com for pattern definitions and trading psychology principles. Additional market context can be found at coindesk.com.
Conclusion
Mastering BTC chart patterns equips traders for profitable decisions in 2026's dynamic environment. Apply these methods consistently, integrate on-chain signals, and prioritize risk controls to navigate volatility effectively. Continuous practice and adaptation will separate successful traders from those who rely on guesswork.

No comments yet. Be the first!