 CryptoChain Blog
Introduction to 2026 Crypto Cycle Timing
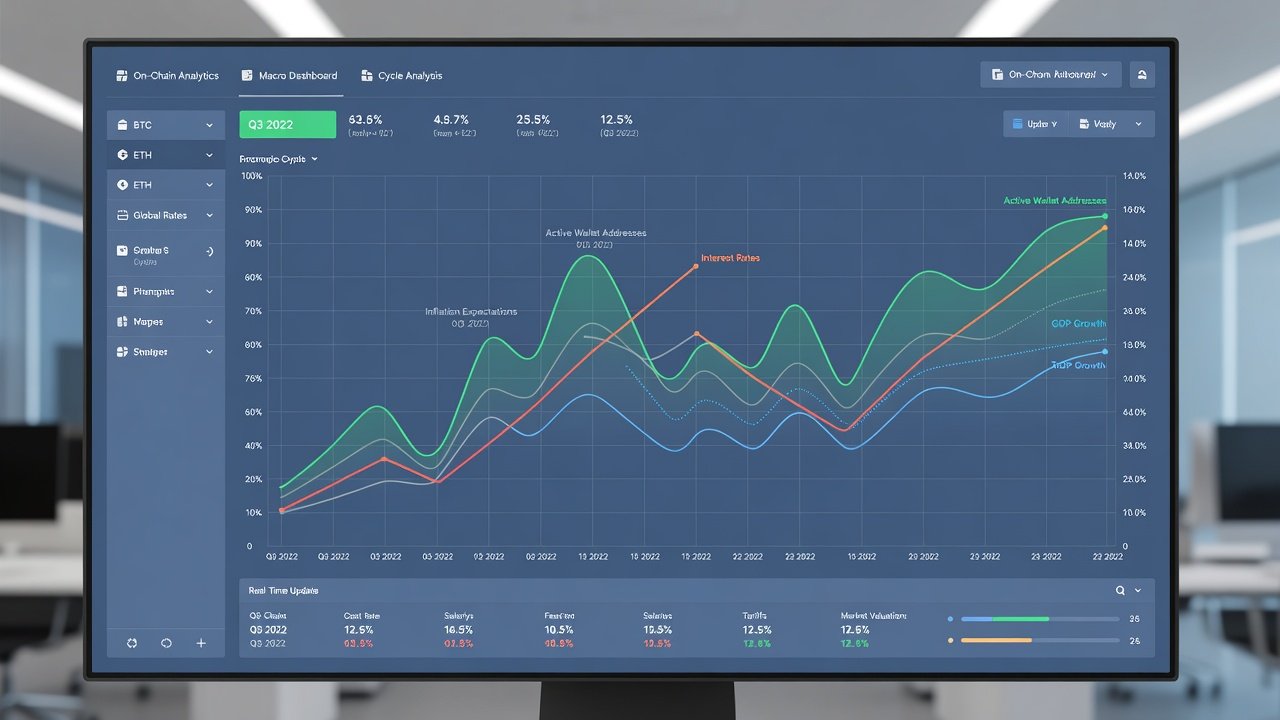
The cryptocurrency market operates in distinct cycles driven by a mix of internal blockchain data and broader economic forces. In 2026, investors can gain an edge by blending on-chain metrics such as exchange inflows and realized price with key macro indicators including interest rates and inflation data. This integrated approach helps identify high-probability entry and exit points amid expected volatility. Market participants who rely solely on price action often miss the underlying shifts that on-chain and macro data reveal. By examining transaction flows on the blockchain alongside policy decisions from central banks, traders develop a more nuanced view of supply and demand dynamics.
Understanding these signals allows traders to move beyond simple price charts and build resilient frameworks. Throughout this guide, we explore practical methods, real-world case studies, and tools for daily monitoring. The goal is to create repeatable processes that adapt to changing conditions rather than chasing every short-term fluctuation.
Core On-Chain Metrics for Cycle Analysis
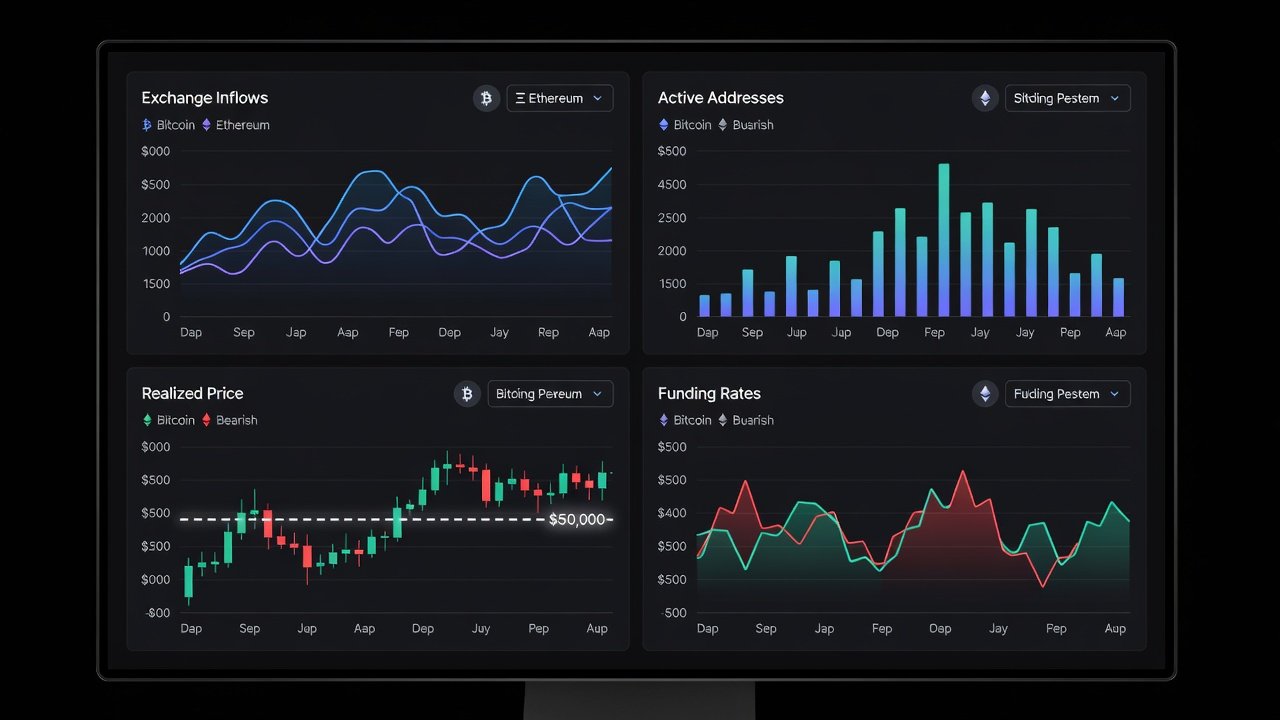
On-chain data provides transparent insights into market behavior. Exchange inflows often signal potential selling pressure when large volumes move to trading platforms. When coins flow into exchanges at elevated rates, it frequently precedes increased selling activity as holders seek liquidity. Conversely, outflows to private wallets suggest accumulation by long-term investors. Realized price, calculated as the average acquisition cost of all coins based on their last on-chain movement, acts as a dynamic support or resistance level. Traders can compare the current spot price against this realized price to gauge whether the market is in profit or loss territory overall.
Monitoring these metrics reveals accumulation or distribution phases. For instance, declining exchange inflows combined with rising realized price typically indicates strong holder conviction. Additional metrics worth tracking include active addresses and transaction volume, which help confirm whether network activity supports the price trend. These on-chain indicators become especially powerful when viewed over multi-week periods rather than daily snapshots.
Integrating Macro Signals
Macro factors like Federal Reserve interest rate decisions and inflation readings from the Bureau of Labor Statistics heavily influence risk assets. Lower rates generally boost crypto demand by reducing the opportunity cost of holding volatile assets. Rising inflation can trigger safe-haven flows or volatility depending on how investors perceive the broader environment. Cross-referencing these releases with on-chain movements creates a more complete picture. A period of falling interest rates alongside low exchange inflows often precedes bullish moves, while tightening policy paired with rising inflows can foreshadow corrections.
Key data releases to watch include monthly CPI reports and FOMC meeting outcomes. Using resources such as Federal Reserve announcements and BLS reports ensures access to primary sources. Incorporating FRED economic data allows for historical comparisons of rate cycles against previous crypto market phases.
Practical Frameworks for Entry and Exit Points
Develop a scoring system that weights on-chain and macro signals. Assign points for bullish conditions such as negative net exchange flows and dovish rate policies. Enter positions when the composite score exceeds a threshold, and exit when it drops below another level. Adjust thresholds based on backtesting against prior cycles to account for changing market maturity.
Step-by-step example one: 1. Track daily exchange inflow data from multiple exchanges. 2. Compare current realized price to spot price for profit/loss context. 3. Cross-reference with the latest Federal Reserve announcements. 4. Adjust position size based on inflation trends. A second example involves weekly aggregation: compile seven days of inflow data, overlay the most recent inflation print, and only act if both on-chain and macro signals align in the same direction for at least three consecutive days.
Comparison Tables of Signal Combinations
| Signal Combination | On-Chain Condition | Macro Condition | Typical Market Outcome | Recommended Action |
|---|---|---|---|---|
| Bullish Setup | Low inflows + rising realized price | Falling rates + stable inflation | Strong upward cycle phase | Gradual position building |
| Bearish Setup | High inflows + falling realized price | Rising rates + high inflation | Distribution and correction | Reduce exposure or hedge |
| Mixed Signals | Neutral flows | Stable rates | Range-bound volatility | Wait for confirmation |
| High Conviction Bull | Outflows + realized price support | Rate cuts expected | Extended rally potential | Increase allocation cautiously |
Use this table as a quick reference when evaluating daily conditions and always document the rationale for each trade decision.
Case Studies from Recent Cycles
During the 2024-2025 cycle, periods of reduced exchange inflows aligned with Federal Reserve rate cuts preceded major rallies. In one instance, sustained outflows over four weeks coincided with the first rate reduction, leading to a multi-month advance. In contrast, spikes in inflows during inflation surges led to sharp drawdowns, highlighting the value of combined analysis. Traders who waited for both signals to align avoided entering near local tops.
Another example from mid-2025 showed realized price acting as support when macro data turned favorable, allowing early entries ahead of the next leg up. The convergence of declining inflows, rising realized price, and dovish central bank commentary created a high-probability setup that played out over several months. These cases demonstrate why isolated signals can mislead while integrated frameworks improve timing accuracy.

Risk Adjustments and Position Sizing
Always scale exposure according to signal strength and overall market liquidity. Reduce position sizes during low-volume periods to avoid false breakouts. Implement stop-losses based on realized price deviations rather than arbitrary percentages. For example, consider exiting if the spot price falls more than 15 percent below realized price during a bearish macro environment. Diversify across multiple time frames by maintaining both short-term tactical positions and longer-term holdings that ignore daily noise.
Building a Simple Daily Monitoring Dashboard
Create a basic dashboard using free tools or spreadsheets. Pull on-chain data from public APIs, overlay macro releases from official sources, and set alerts for threshold breaches. Update the dashboard each morning to review composite scores before making decisions. Start by listing the key metrics in columns, then add conditional formatting to highlight when scores cross your predefined thresholds. Include a notes section for recording any unusual market events or data revisions. Over time, this habit builds a personal database of what worked and what did not across different cycle stages.
Common Pitfalls and How to Avoid Them
- False signals during low-volume weekends or holidays – verify with multiple data sources and require at least two consecutive days of confirmation.
- Over-reliance on a single metric – always require confirmation from both on-chain and macro categories before acting.
- Ignoring lag in official data releases – use preliminary estimates where available and cross-check with futures markets for early clues.
- Neglecting liquidity considerations – reduce trade size when on-chain volume metrics show thin participation.
- Emotional overrides of the framework – maintain a trading journal that logs every deviation and its outcome.
Actionable Checklists for Readers
- Review exchange inflow trends daily across at least three major platforms.
- Compare realized price to current market price and note the deviation percentage.
- Check latest interest rate and inflation updates from primary government sources.
- Calculate composite signal score using your weighted system.
- Adjust positions and log rationale in the dashboard.
- Reassess weekly for macro shifts and update any model parameters.
- Conduct monthly backtesting review against historical data.
Conclusion
Blending on-chain metrics with macro signals equips investors with a robust framework for navigating the 2026 crypto cycle. By following the step-by-step methods, tables, and checklists outlined above, readers can improve timing accuracy while managing risk effectively. Consistent application of these principles turns reactive trading into a disciplined, data-driven process that adapts as market conditions evolve.

No comments yet. Be the first!