 CryptoChain Blog
Introduction to On-Chain Dashboards for Crypto Cycle Timing
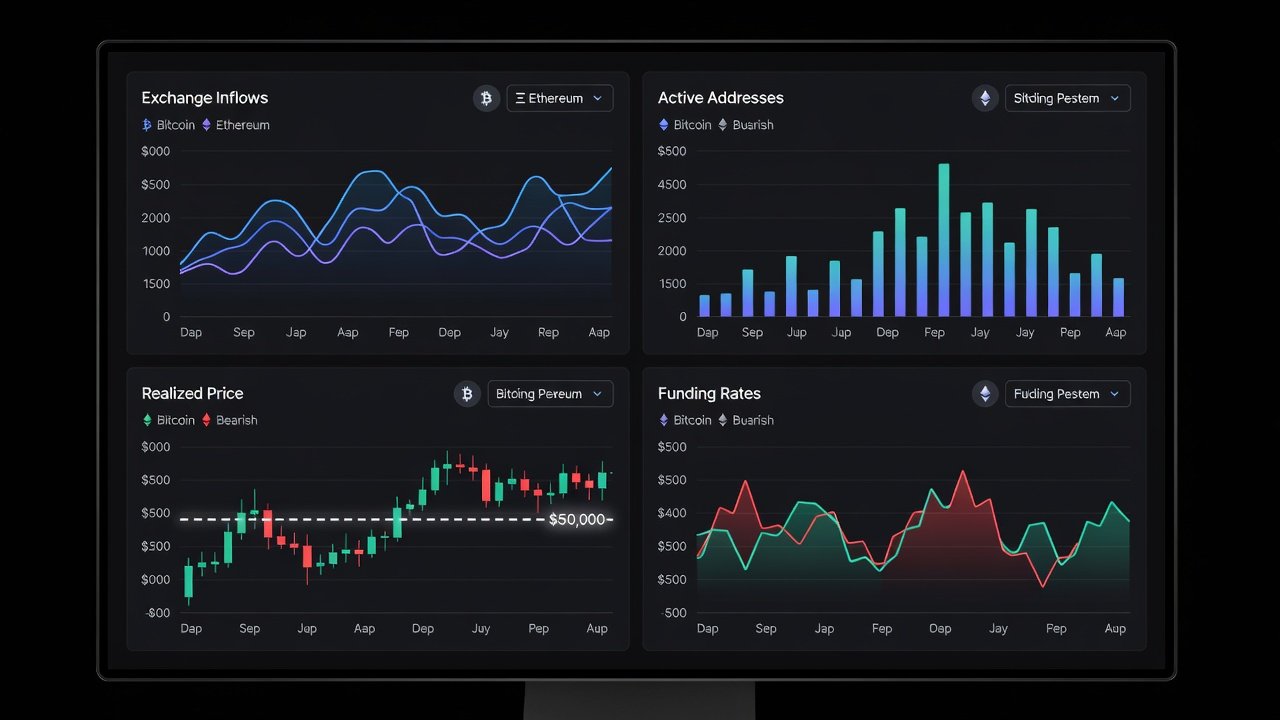
Timing the 2026 crypto cycle requires more than price charts alone. Custom on-chain dashboards combine exchange inflows, active addresses, realized price, and funding rates to deliver actionable signals that help investors identify accumulation zones, distribution phases, and potential reversal points. This comprehensive guide walks through practical construction using accessible free and low-cost tools, provides real-world interpretation during volatility spikes, and includes direct comparisons to historical cycle data for improved entry and exit decisions. By following these steps, readers can create a repeatable framework that adapts across different market conditions and portfolio strategies.
The 2026 cycle is expected to feature heightened volatility driven by institutional adoption, regulatory shifts, and macroeconomic influences. Relying solely on price action often leads to emotional decisions, whereas on-chain metrics offer objective insights into underlying network health and holder behavior. Building a personalized dashboard ensures that signals are tailored to individual risk tolerance rather than generic market commentary.
Core Metrics Explained in Detail
Exchange inflows track the volume of coins moving from private wallets to centralized trading platforms. Large inflows frequently precede selling pressure as holders seek liquidity, while sustained outflows may indicate long-term holding. Monitoring these flows across multiple exchanges provides early warnings of distribution events. Active addresses measure unique wallet interactions on the blockchain and serve as a proxy for genuine user engagement. Rising active addresses during price consolidation often signal organic accumulation, whereas declining counts amid price rallies can reveal weakening participation.
Realized price represents the average acquisition cost of all coins currently in circulation, calculated by weighting each transaction by its value at the time of movement. This metric acts as a dynamic support or resistance level because it reflects the breakeven point for the average holder. Funding rates from perpetual futures contracts reveal the cost of maintaining leveraged positions and highlight sentiment extremes. When funding rates turn sharply positive, excessive optimism may be present; deeply negative rates often coincide with fear-driven capitulation. Combining these four metrics creates a multi-layered view that single-indicator approaches cannot match.
Selecting and Configuring Free and Low-Cost Tools
Effective dashboards begin with reliable data sources. Glassnode supplies comprehensive on-chain datasets including exchange flows and realized price calculations through both web interface and API access. Dune Analytics allows users to write custom SQL queries that aggregate active address trends across multiple chains. Supplementary market context comes from DeFiLlama for ecosystem-wide metrics and CoinGecko for real-time price feeds that can be cross-referenced with on-chain activity.
Users can export data into Google Sheets for initial prototyping or advance to Python scripts using libraries such as Pandas for data manipulation and Plotly for interactive visualizations. This layered toolset supports both no-code experimentation and fully automated pipelines without requiring paid enterprise licenses at the outset.
Step-by-Step Dashboard Construction Process
- Register for API keys on Glassnode and Dune, then configure authentication in your chosen environment.
- Create separate data pipelines for each metric: query daily exchange inflow volumes, count unique active addresses over rolling seven-day windows, compute realized price using on-chain transaction history, and pull funding rate snapshots every four hours from exchange endpoints.
- Normalize all datasets to a common timestamp format and merge them into a single master table.
- Build visualization layers that include line charts for trends, heatmaps for correlation strength, and threshold indicators that change color when metrics breach user-defined levels.
- Add a summary panel that displays current cycle phase classification based on combined signal strength.
- Implement export functions so the dashboard can generate weekly PDF reports for offline review.
After initial setup, run the system for at least two weeks to identify any data gaps or latency issues before relying on it for live decisions.
Interpreting Signals During Volatility Spikes
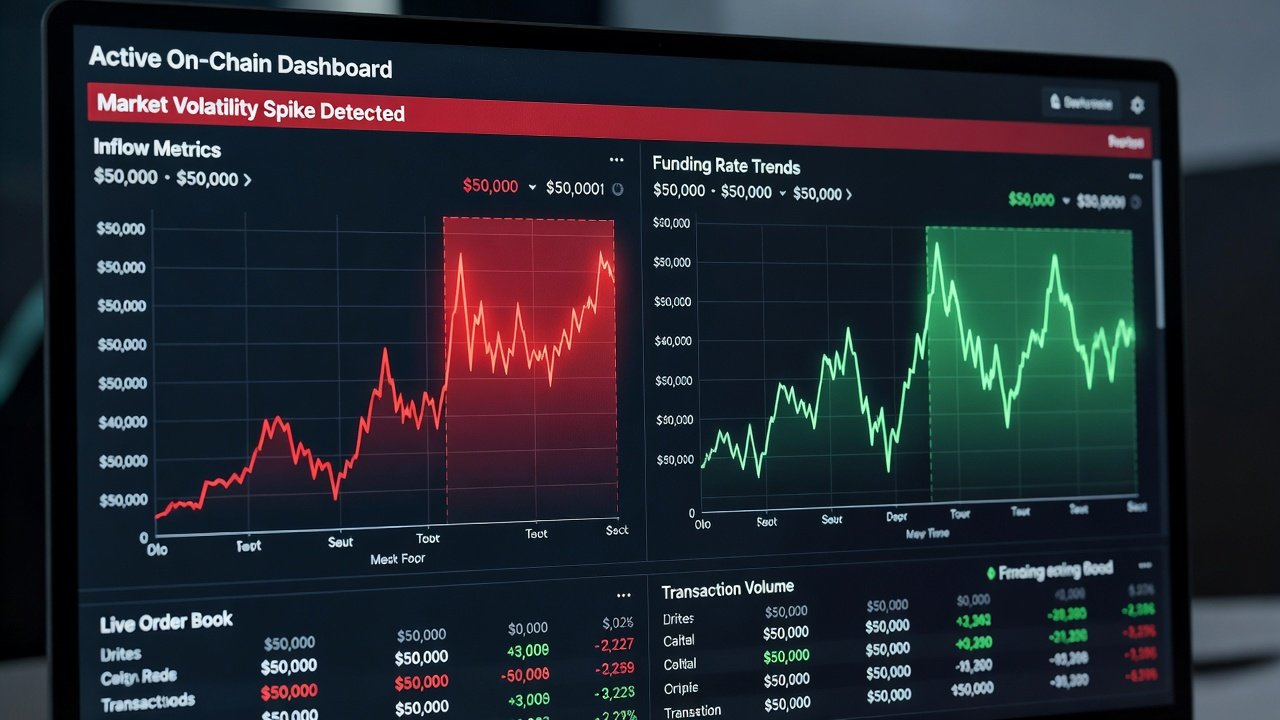
During a sharp price decline, simultaneous spikes in exchange inflows above the 30-day average combined with falling active addresses typically mark capitulation bottoms. In the March 2020 crash, similar patterns preceded a rapid recovery once inflows subsided. Conversely, when realized price remains stable while funding rates climb above historical norms, the dashboard flags potential local tops caused by leveraged speculation. A practical example from the May 2021 correction showed funding rates reaching extreme positive territory three days before a 30 percent drawdown, giving dashboard users time to reduce exposure.
Another case involved monitoring Ethereum active addresses during the 2022 bear market recovery. When addresses began rising while exchange inflows stayed muted, the combined signal correctly anticipated the subsequent rally. Users should log each signal interpretation in a trading journal to refine thresholds over multiple cycles.
Historical Cycle Comparisons for Greater Accuracy
Aligning current readings with 2017 and 2021 bull market peaks reveals recurring behaviors. In both prior cycles, realized price served as reliable support during mid-cycle corrections, and active address growth plateaued roughly six weeks before major tops. Funding rate divergences from price action also appeared consistently at turning points. By overlaying normalized historical curves on the live dashboard, users can quantify how closely present conditions match past setups and adjust position sizing accordingly.
Common Pitfalls and How to Avoid Them
- Over-reliance on a single metric without cross-checking others, which can produce false positives during low-liquidity periods.
- Ignoring exchange-specific reporting delays that may lag true on-chain movements by several hours.
- Failing to account for stablecoin inflows that sometimes mask underlying selling pressure.
- Neglecting to recalibrate thresholds after major network upgrades or regulatory events that alter metric baselines.
- Allowing confirmation bias by only reviewing signals that support an existing thesis.
Regular backtesting against archived data helps surface these issues before they affect real capital allocation.
Automating Alerts and Daily Workflow
Configure webhook notifications through Dune or Glassnode to trigger when any metric crosses a predefined boundary, such as exchange inflows exceeding two standard deviations from the mean. Integrate these alerts with messaging platforms like Telegram or email services for immediate delivery. A sample workflow includes morning review of overnight changes, midday signal validation, and evening logging of any triggered alerts. Advanced users can add conditional logic so that multiple metrics must align before an alert fires, reducing noise.
Integrating Macro Indicators for Broader Context
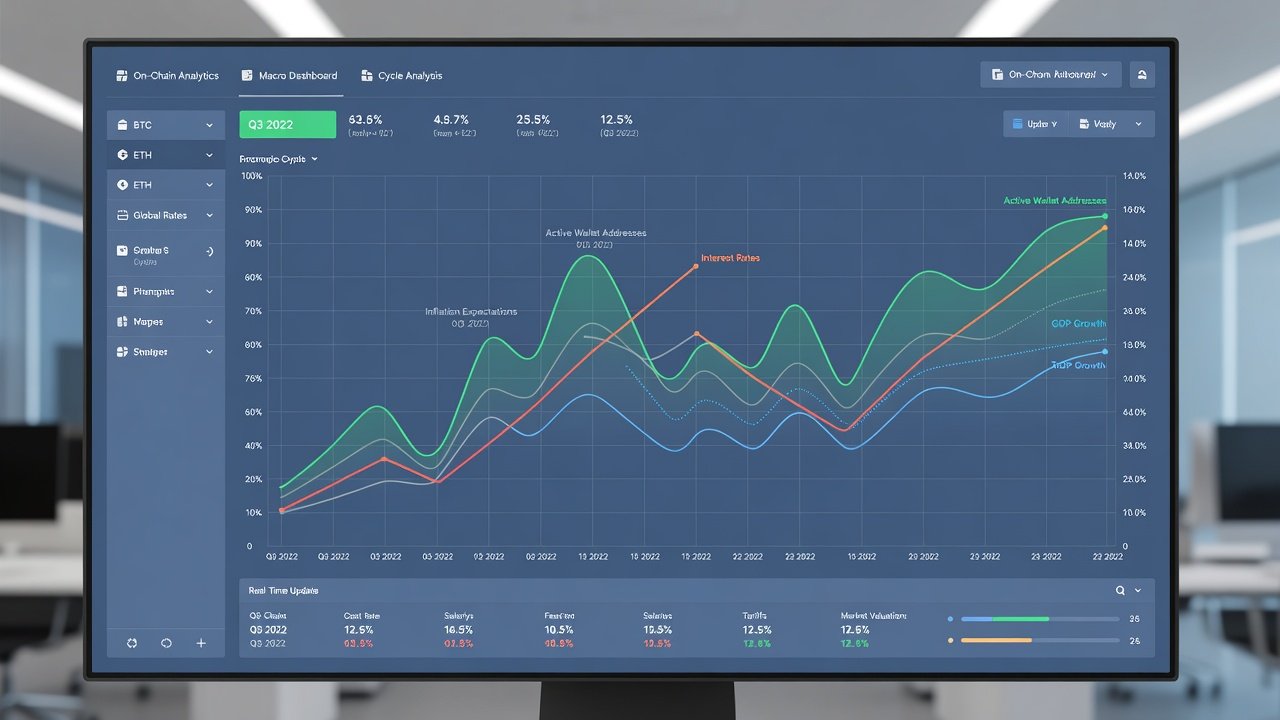
Layering traditional economic data strengthens on-chain signals. Track correlations between dashboard readings and indicators such as the US Dollar Index, 10-year Treasury yields, and equity market volatility measures. When on-chain accumulation coincides with declining bond yields, conviction in a cycle bottom increases. Conversely, strong on-chain buying during rising rate environments may warrant smaller position sizes. This integration prevents overconfidence in isolated blockchain metrics.
Checklist for Full Implementation
- Confirm API connectivity and data freshness for all four core metrics.
- Backtest the complete signal set against at least two full market cycles.
- Establish clear threshold rules and document them in a reference guide.
- Set up automated alerts with appropriate severity levels.
- Schedule monthly reviews to incorporate new data sources or adjust parameters.
- Create backup data exports in case primary sources experience outages.
- Test dashboard performance on both desktop and mobile views.
- Train any team members or collaborators on interpretation guidelines.
FAQ
How does this framework adapt for small portfolios under $50,000?
Emphasize relative percentage changes rather than absolute volumes. The same signal logic applies, but position sizing should remain conservative to manage risk effectively.
Can the entire dashboard operate using only free tools?
Yes, combining open APIs from Glassnode and Dune with spreadsheet formulas or basic Python scripts produces functional results without any paid subscriptions.
What is the recommended starting metric for complete beginners?
Begin with realized price because it provides intuitive visual anchors on price charts and requires the least additional processing to interpret.
How often should thresholds be recalibrated?
Review and adjust thresholds every 90 days or immediately after significant network events such as halvings or major protocol upgrades.
Is historical backtesting sufficient for 2026 predictions?
Backtesting provides valuable context but should be combined with forward-looking scenario analysis that incorporates potential regulatory or macroeconomic developments.
Conclusion
Custom on-chain dashboards empower precise 2026 crypto cycle timing when constructed methodically around exchange inflows, active addresses, realized price, and funding rates. Consistent application, thorough historical validation, macro integration, and disciplined alert management transform raw data into reliable trading intelligence that supports better risk-adjusted returns across varying market environments.
No comments yet. Be the first!