 CryptoChain Blog
Introduction to ETF Inflows as a 2026 Crypto Trading Tool
Traders in 2026 are increasingly turning to ETF inflow data as a leading indicator for cryptocurrency market movements. This how-to guide explains practical frameworks for analyzing daily flows to identify liquidity shifts and potential altcoin rotations. By combining ETF metrics with on-chain volume and funding rates, traders can anticipate Bitcoin versus Ethereum dominance changes before they appear in spot prices. ETF products for Bitcoin and Ethereum have matured, providing transparent daily inflow and outflow figures that reflect institutional sentiment. These flows often precede broader market rotations, offering an edge when interpreted correctly. The frameworks outlined here build on established cycle timing methods while incorporating fresh data visualization techniques suited to the current regulatory environment.
Understanding Daily ETF Flow Tracking
Begin by monitoring official daily reports from major ETF issuers. Set up automated alerts for inflows exceeding historical averages. Focus on net flows rather than gross volumes to filter noise from arbitrage activity. Key steps include collecting data from multiple providers and averaging the results for accuracy, comparing current inflows against 30-day and 90-day moving averages, and flagging days where net inflows surpass 1.5 times the recent average as potential liquidity signals. This baseline tracking forms the foundation for more advanced correlation analysis. Traders should also review weekly summaries to identify sustained trends rather than isolated spikes. Tools such as spreadsheet templates or dedicated dashboards can automate much of this process, allowing focus on interpretation rather than raw data collection.
Correlating ETF Flows with On-Chain Metrics
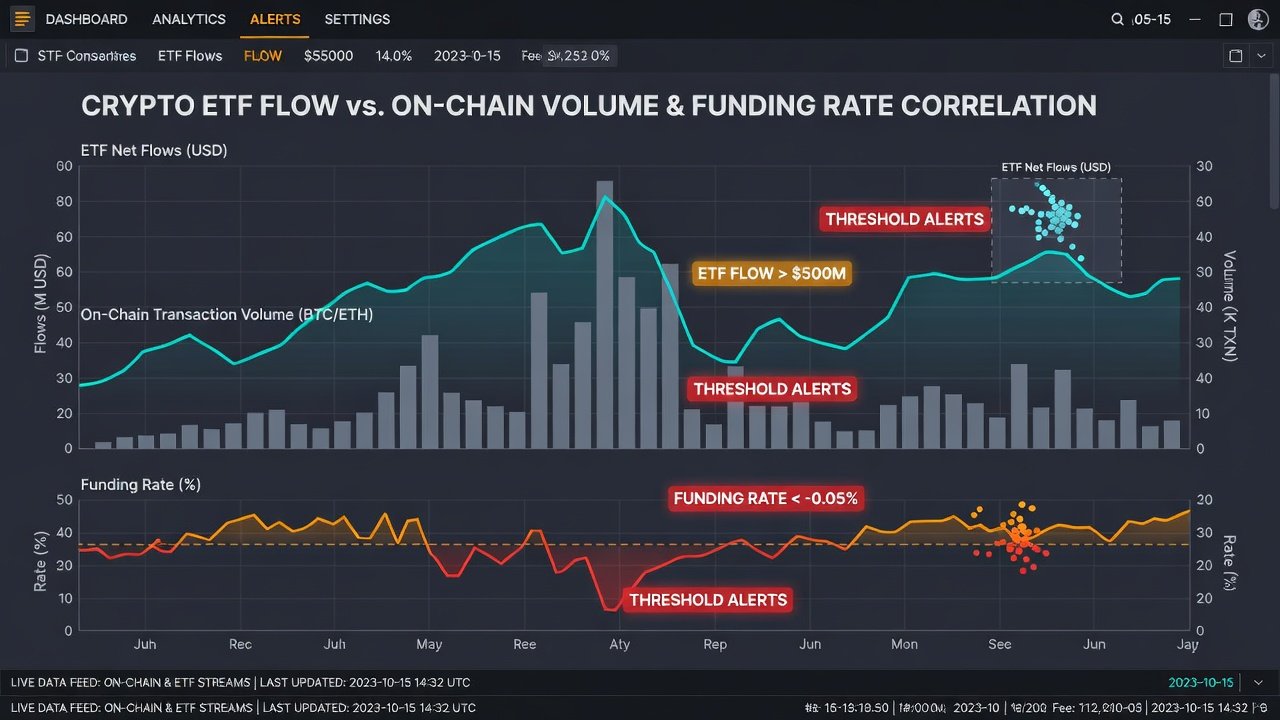
Effective frameworks require cross-referencing ETF inflows with on-chain volume and funding rates. High ETF inflows paired with rising on-chain transfer volumes often confirm genuine demand rather than speculative positioning. Funding rates from perpetual futures markets provide additional context. Positive funding rates during strong ETF inflows suggest leveraged long positions supporting the move, while negative rates may indicate hedging activity that could reverse quickly. Practical correlation method: Calculate a simple ratio of ETF inflow volume to on-chain active addresses over the same period. Ratios above recent norms frequently precede altcoin rotations as capital seeks higher-beta opportunities. Additional layers include monitoring exchange reserve changes and large wallet movements to validate whether institutional flows are translating into broader network activity. For deeper insight, overlay these metrics on multi-week charts to spot divergences early.
Identifying Bitcoin vs Ethereum Dominance Shifts
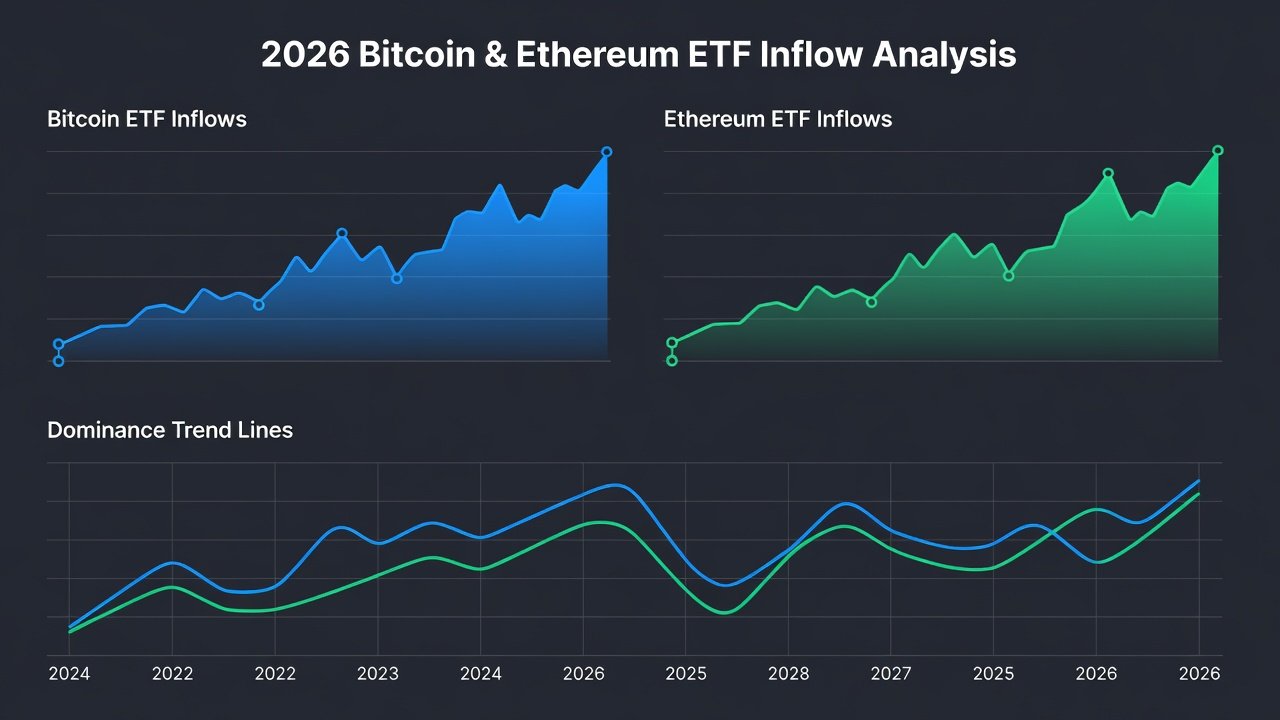
Separate Bitcoin and Ethereum ETF flow data to detect early dominance changes. Sustained Bitcoin ETF inflows alongside flat or negative Ethereum flows typically strengthen Bitcoin dominance. The reverse pattern often signals rotation into Ethereum and altcoins. Watch for divergence thresholds: when one asset's ETF inflows exceed the other's by more than 40% over five consecutive trading days, historical patterns show a high probability of dominance movement within the following two weeks. Real 2026 examples demonstrate how these shifts influenced altcoin performance, with capital rotating into sectors such as decentralized finance once Ethereum inflows accelerated. Visualization of dominance percentages alongside flow differentials helps traders act before spot market reactions fully materialize.
Inflow Thresholds and Sector Rotation Signals
Develop personal thresholds based on backtested 2026 data. Conservative traders may act only on inflows above the 80th percentile of the prior quarter. More aggressive strategies incorporate moderate inflows when accompanied by improving funding rates. Sector rotation signals emerge when inflows into broad-market ETFs coincide with outflows from single-asset products. This pattern often precedes capital moving into mid-cap altcoins. Maintain a watchlist of rotation candidates by monitoring which sectors receive secondary flows after initial Bitcoin or Ethereum surges. Practical application involves creating custom alerts for specific threshold breaches and reviewing them during low-volatility periods to refine accuracy over time.
Risk Filters and Avoiding False Signals
Volatility spikes can generate misleading inflow data. Apply these risk filters: require confirmation from at least two independent data sources, ignore single-day outliers unless supported by on-chain activity, and reduce position size when funding rates diverge sharply from inflow direction. Comparison of ETF versus spot market behavior shows that ETF flows tend to lag spot market moves by 12-48 hours during calm periods but lead during institutional-driven rallies. Common mistakes include overreacting to headline inflow numbers without context and neglecting weekend or holiday data gaps that can distort averages. A disciplined review process that includes cross-market checks minimizes these errors.
Expanded Comparison of ETF and Spot Market Dynamics
Beyond basic tables, consider multi-factor comparisons that incorporate liquidity depth, settlement times, and regulatory oversight differences. ETF structures often provide clearer institutional footprints, while spot markets reflect retail sentiment more immediately. In 2026 examples, periods of ETF inflow acceleration aligned with reduced spot volatility, creating favorable entry points for longer-term positions. Traders benefit from maintaining parallel watchlists for both markets to capture complementary signals.
| Metric | ETF Behavior | Spot Market Behavior |
|---|---|---|
| Response Time | Delayed by hours to days | Immediate |
| Institutional Bias | Stronger | Mixed retail/institutional |
| Volatility Filter | More stable signals | Higher noise |
| Data Transparency | Daily official reports | Real-time but fragmented |
Practical Tools and Data Visualization Tips
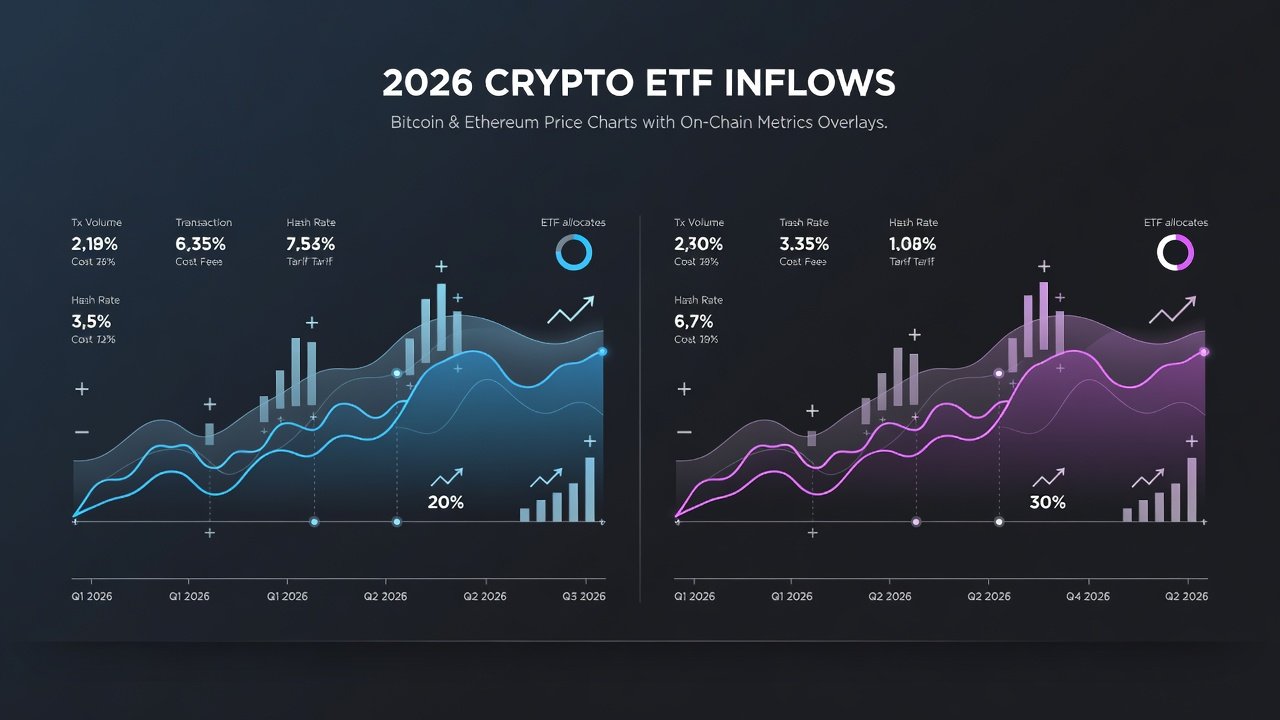
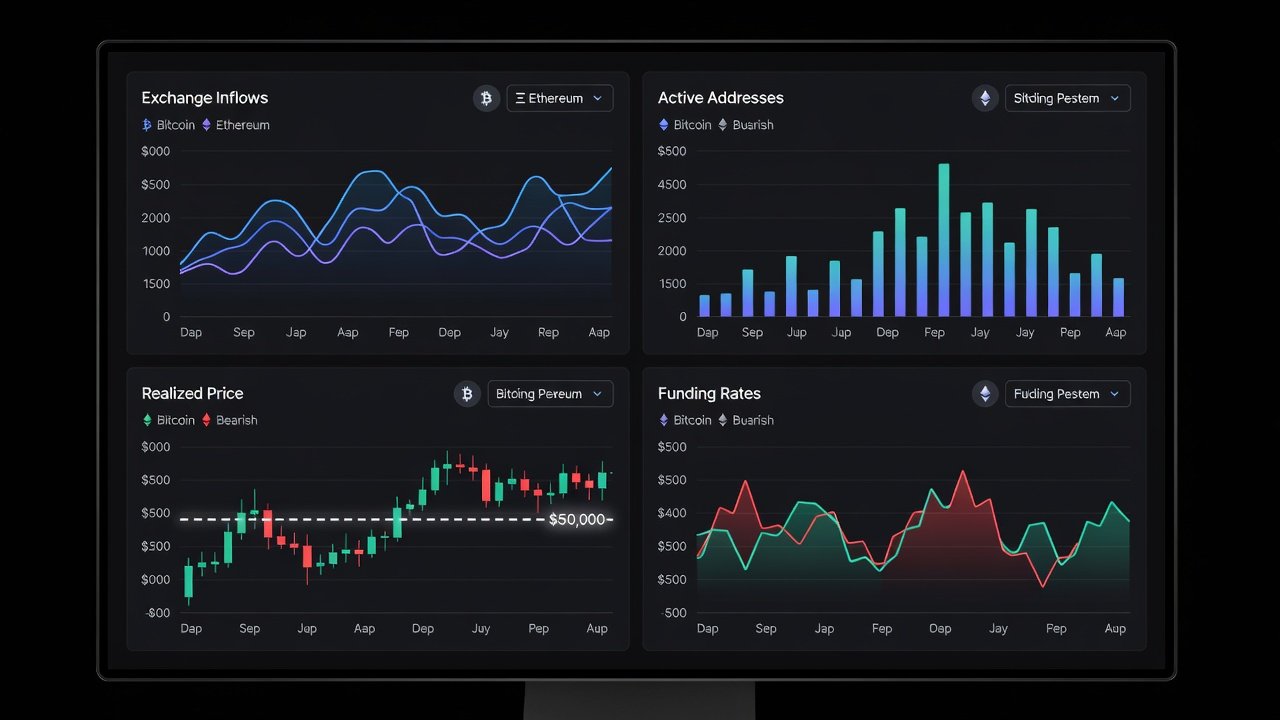
Effective visualization enhances framework application. Use layered charts combining ETF flows, on-chain metrics, and dominance lines. Export weekly data sets for custom analysis and backtesting. Authoritative resources such as SEC filings and CFTC reports provide foundational regulatory context for interpreting flows. Additional references include Ethereum project documentation for on-chain fundamentals.
FAQs on ETF Inflow Frameworks
How do I avoid false signals during volatility spikes? Cross-reference with on-chain metrics and require multi-day confirmation before acting on any single inflow report.
What is the best time to check daily flows? Most issuers release data before market open; review within the first two hours of trading for optimal timing.
Can these frameworks apply to altcoin ETFs? Yes, but liquidity is lower, so use wider thresholds and stronger on-chain confirmation.
How often should thresholds be recalibrated? Review and adjust quarterly based on evolving market conditions and new ETF product launches.
What role do macroeconomic events play? Major policy announcements can amplify or mute inflow signals, requiring additional filters during those periods.
Conclusion
Mastering 2026 ETF inflow frameworks equips traders with a data-driven approach to spotting liquidity shifts and dominance changes. By integrating daily tracking, on-chain correlations, and disciplined risk filters, market participants can improve timing and reduce exposure to false signals. Consistent application of these techniques extends proven cycle concepts into the current ETF era, supported by robust visualization and ongoing refinement of personal thresholds.
No comments yet. Be the first!