 CryptoChain Blog

Introduction to 2026 Crypto Cycle Timing
Navigating cryptocurrency markets in 2026 requires more than intuition or basic technical analysis. Traders and investors increasingly rely on on-chain metrics and volume frameworks to identify optimal entry and exit points with greater precision. These data-driven tools reveal underlying network health, capital flows, and sentiment shifts that price charts alone cannot fully capture. This comprehensive guide builds on established market cycle principles to deliver actionable frameworks for timing decisions specifically tailored to Bitcoin and Ethereum in the current cycle environment.
By analyzing indicators such as exchange inflows, active addresses, realized price, and funding rates, market participants can distinguish between accumulation phases and distribution periods more effectively. Volume patterns further refine these signals by highlighting conviction behind price movements. Throughout this article, we explore step-by-step interpretation methods, detailed bull versus bear phase comparisons, risk-adjusted allocation tactics, and real-world 2026 case studies that demonstrate how these tools performed in practice. The goal is to equip readers with a repeatable process that reduces emotional decision-making and improves long-term outcomes.
Core On-Chain Metrics for Cycle Analysis
Exchange inflows serve as a leading indicator of potential selling pressure. When large amounts of Bitcoin or Ethereum move from self-custody wallets to centralized exchanges, it often signals upcoming distribution by holders looking to realize gains or cut losses. Monitoring these flows in real time helps anticipate volatility spikes and potential trend reversals. In 2026, analysts track both absolute inflow volumes and their deviation from 30-day averages to filter out normal operational transfers.
Active addresses provide insight into network adoption and genuine usage. Rising active addresses during price consolidation typically indicate growing organic demand rather than speculative fervor driven by leverage. This metric becomes especially powerful when segmented by new versus returning addresses, revealing whether growth stems from fresh participants or established holders increasing activity. Realized price, calculated as the average cost basis of all coins based on their last on-chain movement, acts as a dynamic support or resistance level. Deviations from realized price reveal periods of overvaluation or undervaluation, offering clear reference points for mean-reversion trades.
Funding rates on perpetual futures contracts reflect leveraged sentiment across derivatives markets. Positive rates indicate bullish bias among traders willing to pay to maintain long positions, while negative rates suggest bearish positioning that may precede rebounds when shorts become overcrowded. Combining funding rate trends with spot market data creates a more complete picture of market positioning.
Interpreting Volume Patterns in Depth
Volume analysis complements on-chain data by confirming momentum and conviction. High volume accompanying price advances validates trend strength, whereas declining volume during rallies often precedes reversals as participation wanes. In 2026 frameworks, traders compare spot volume against derivatives volume to gauge whether moves are driven by spot buyers with actual holdings or leveraged speculation that can unwind quickly. Breakouts accompanied by expanding volume and improving on-chain fundamentals offer higher-probability entries with defined risk parameters.
Advanced practitioners also examine volume-weighted average price (VWAP) deviations alongside on-chain flows to identify institutional accumulation zones. Low-volume pullbacks in established uptrends frequently present favorable re-entry opportunities when supported by stable or declining exchange inflows.
Bull Phase Versus Bear Phase Signals
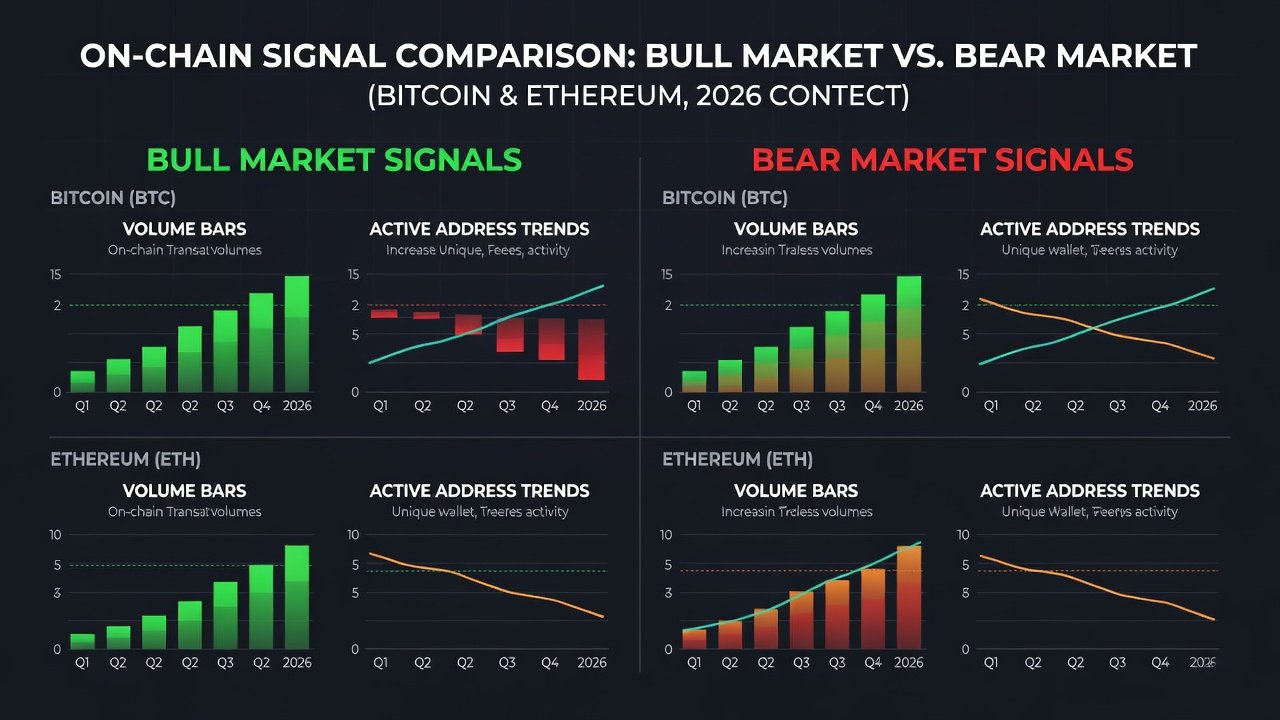
Bull phases exhibit declining exchange inflows, rising active addresses, realized price acting as dynamic support, and moderately positive funding rates that reflect healthy leverage without excess. These conditions favor gradual accumulation with stop-losses placed below recent realized price levels and position sizes scaled to overall portfolio volatility. Bear phases show the opposite pattern: surging inflows to exchanges, contracting active addresses, realized price functioning as resistance, and persistently negative funding rates that indicate fear and potential capitulation. Risk management in bear phases shifts toward smaller position sizes, wider stops only when signals align for reversal, and increased cash allocations.
Step-by-Step Interpretation Framework
- Collect daily data from multiple sources for exchange inflows, active addresses, realized price, and funding rates across both Bitcoin and Ethereum.
- Calculate 30-day and 90-day moving averages to filter noise and identify directional trends while avoiding short-term fluctuations.
- Cross-reference with volume metrics: confirm on-chain shifts only when volume supports the directional move and shows increasing participation.
- Map signals to cycle phase by aligning current readings with historical bull or bear patterns for broader context and probability weighting.
- Apply allocation rules by scaling positions based on confluence strength, overall portfolio risk limits, and correlation between assets.
- Document each decision with timestamped notes to review performance and refine the framework over multiple cycles.
2026 Case Studies: Bitcoin and Ethereum
Bitcoin's Q1 2026 accumulation phase demonstrated classic on-chain signals in action. Exchange inflows dropped steadily over several weeks while active addresses climbed consistently, pushing realized price upward and establishing it as reliable support. Volume remained moderate during the base-building period until a decisive breakout occurred with expanding participation that confirmed the transition to expansion mode. Traders who entered systematically on confluence of these metrics achieved favorable risk-reward ratios and managed exits as inflows began to normalize.
Ethereum followed a similar yet distinct path in mid-2026 around key network developments. Funding rates turned positive ahead of major upgrades, coinciding with rising active addresses that reflected increased developer and user engagement. Realized price provided a firm floor during brief pullbacks, and volume spikes validated the advance. This allowed for systematic profit-taking as exchange inflows started to rise again, illustrating how the framework adapts to asset-specific catalysts while maintaining core discipline.
Risk-Adjusted Allocation Tactics
Effective timing integrates position sizing directly with signal strength rather than fixed percentages. High-conviction setups where multiple metrics align across on-chain, volume, and funding data warrant larger allocations within predefined risk budgets. Lower-conviction periods call for reduced exposure or temporary cash holdings to preserve capital. Always maintain diversification across Bitcoin and Ethereum to mitigate single-asset volatility, and rebalance quarterly or whenever cycle signals shift materially. Stress-testing the framework against previous cycle drawdowns helps calibrate appropriate position limits for different market regimes.
Daily Monitoring Checklist
- Review exchange inflow trends for both assets and note any deviations from recent averages that could signal distribution.
- Track 7-day and 30-day active address changes with attention to new address growth versus returning users.
- Compare current price levels to realized price to identify potential support or resistance zones.
- Monitor funding rate averages across major perpetual markets and watch for extreme readings that indicate crowded trades.
- Assess volume ratios between spot and derivatives markets to gauge participation quality.
- Log all signals daily and cross-reference with any macro developments that could influence capital flows or sentiment.
- Review historical analogs from prior cycles to contextualize current readings and adjust expectations accordingly.
Combining On-Chain Signals with Macro Factors
Macroeconomic developments such as interest rate decisions, inflation data releases, and regulatory announcements can amplify or dampen on-chain signals significantly. Strong on-chain accumulation during favorable macro conditions increases overall conviction and supports larger position sizes. Conversely, conflicting macro headwinds warrant extra caution even when on-chain metrics appear positive, often leading to reduced exposure or delayed entries. Integrating both perspectives creates a more robust timing system that accounts for external drivers of liquidity and risk appetite.
Frequently Asked Questions
What is the most common timing mistake when using these metrics?
Over-reliance on a single metric without volume confirmation or macro context often leads to false signals, premature entries, and unnecessary exits that erode returns over time.
How do I combine these frameworks with broader market analysis?
Use on-chain and volume data as primary filters to establish directional bias, then overlay macroeconomic calendars, sentiment surveys, and geopolitical developments for final decision validation and risk sizing.
Are these methods suitable for altcoins beyond Bitcoin and Ethereum?
Core principles apply across many assets, but liquidity differences require adjusted thresholds, additional scrutiny of token-specific fundamentals, and awareness of lower data reliability in smaller markets.
How often should the daily checklist be reviewed?
Most practitioners perform a full review once per day during active market hours, with lighter checks on weekends when volume and flows tend to be thinner and less representative.
For deeper data exploration and historical datasets, consult resources at Glassnode, CryptoQuant, and Ethereum.org. Foundational cycle concepts are further explained at Bitcoin.org.


No comments yet. Be the first!