 CryptoChain Blog
Introduction to 2026 Crypto Cycle Timing
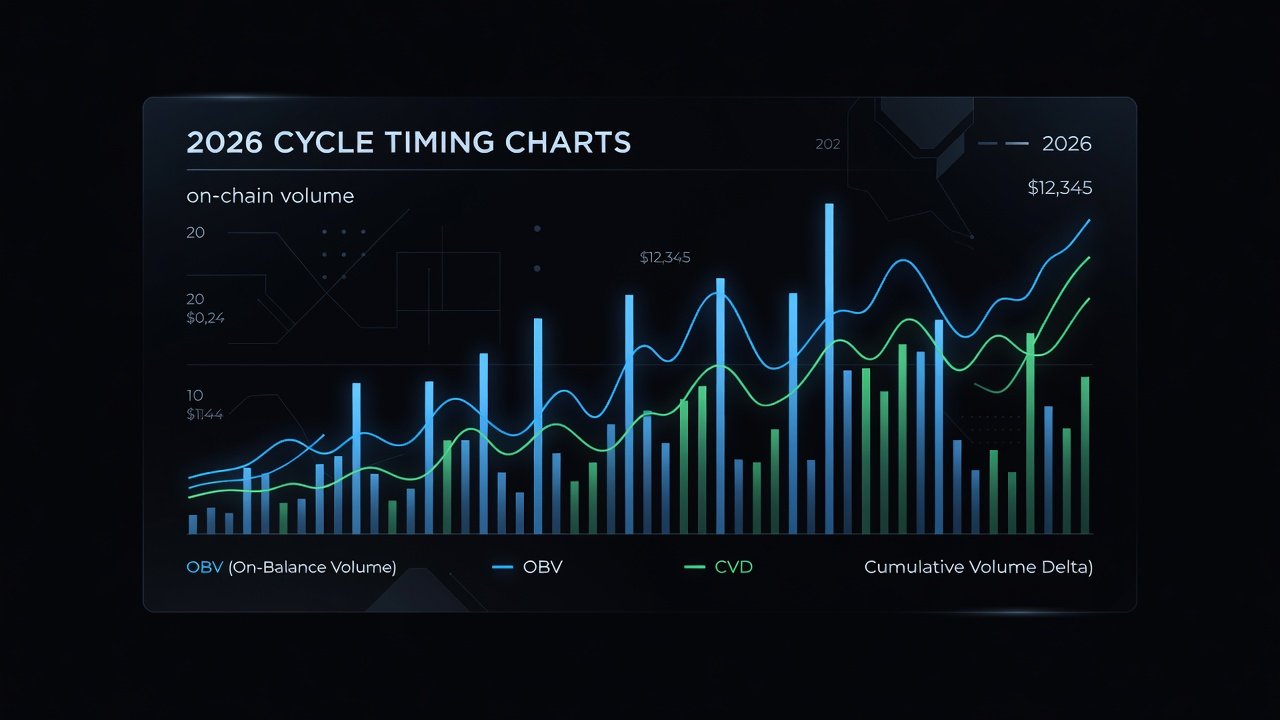
Navigating cryptocurrency market cycles in 2026 requires more than price charts alone. On-chain volume frameworks combine transaction data from blockchains with traditional volume analysis to pinpoint accumulation and distribution phases with greater precision. This approach helps traders and investors identify when smart money is entering or exiting positions, reducing emotional decisions during high volatility periods. The 2026 landscape continues to feature rapid shifts driven by institutional adoption, regulatory developments, and macroeconomic factors, making timing frameworks essential for preserving capital and capturing upside.
By integrating metrics like on-balance volume (OBV) and cumulative volume delta (CVD), market participants can build timing strategies that account for both technical signals and blockchain fundamentals. This article explores step-by-step methods, real-world portfolio applications, risk tactics, and tax implications using recent cycle observations from 2025 through late 2026. Readers will gain actionable insights to apply immediately in their own trading or investing routines.
Understanding Accumulation and Distribution Phases
Accumulation phases occur when large holders quietly build positions at lower prices, often marked by steady on-chain inflows without dramatic price spikes. Distribution phases follow as these holders sell into strength, visible through rising exchange deposits and declining holder conviction. Recognizing these phases early allows investors to position ahead of major moves rather than reacting after prices have already shifted significantly.
Step-by-step identification begins with monitoring active addresses and exchange net flows over multiple timeframes. Next, analyze volume spikes relative to historical averages from the prior 90 days. Finally, cross-reference with holder distribution metrics to confirm whether supply is concentrating or dispersing. These steps create a repeatable framework for timing entries and exits that has proven effective across previous cycles and continues to hold relevance in the current environment.
Integrating Technical Indicators: OBV and CVD
On-balance volume (OBV) tracks cumulative buying and selling pressure by adding or subtracting volume based on price closes. When OBV rises alongside price, it confirms bullish momentum. Cumulative volume delta (CVD) measures the net difference between buy and sell volume in real time, highlighting aggressive buying or selling from large participants. Combining these with on-chain data reveals divergences early. For instance, rising OBV during flat prices may signal hidden accumulation. 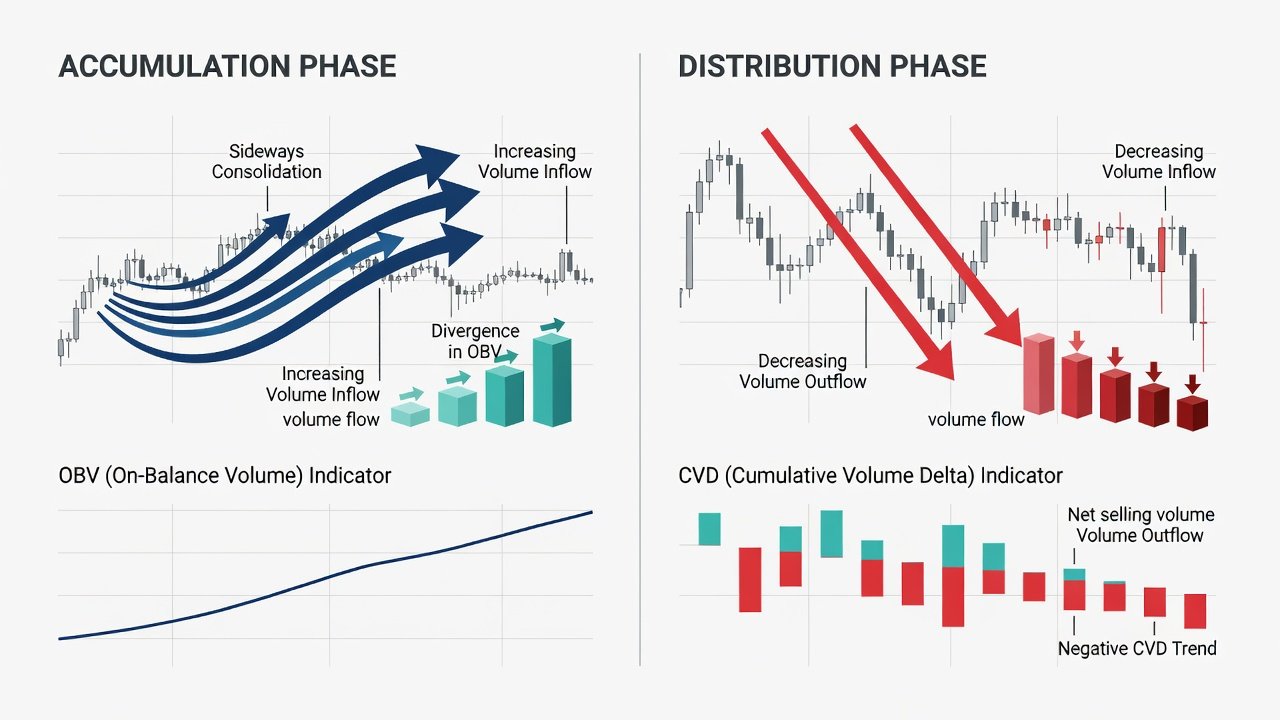
Bull Versus Bear Dynamics: 2025-2026 Comparison
Recent market behavior from 2025 into 2026 shows bull phases characterized by sustained high on-chain volume and increasing long-term holder supply. Bull markets in this period featured consistent daily active addresses above key thresholds and positive exchange outflows. Bear phases feature contracting volume, rising exchange inflows, and rapid distribution across addresses. Comparing these dynamics using 2025-2026 data highlights how volume contraction often precedes price tops by weeks, giving prepared investors time to reduce exposure. Understanding these contrasts helps set realistic expectations for volatility ahead and informs allocation sizing during each regime.
Real Portfolio Examples and Entry/Exit Decisions
Consider a sample allocation starting with 40% Bitcoin and 30% Ethereum during identified accumulation in early 2026. Exit signals trigger when CVD flips negative and OBV diverges from price action, prompting a shift of 15% into stable assets. Re-entry occurs after volume normalizes and on-chain flows stabilize, demonstrating disciplined cycle navigation. A second example involves an altcoin-heavy portfolio that used weekly OBV confirmation to scale out of positions during distribution, avoiding a subsequent 35% drawdown observed in similar assets. These cases illustrate how combining multiple signals produces clearer decision points than relying on price alone.
Risk-Adjusted Allocation Tactics
Effective risk management during cycle shifts involves several practical tactics. Maintain position sizing limits based on volatility bands derived from on-chain turnover rates. Use layered entries during confirmed accumulation to average costs while preserving dry powder for deeper dips. Apply trailing stops tied to CVD thresholds rather than arbitrary percentages. Rebalance quarterly or upon phase confirmation to preserve risk parameters. Additionally, incorporate correlation analysis across assets to avoid over-concentration in correlated tokens during late-stage bull phases. These tactics help smooth returns and reduce the impact of sudden reversals common in 2026 volatility.
Tax Considerations During Cycle Shifts
Tax rules vary by jurisdiction, but realizing gains during distribution phases requires careful tracking of cost basis and holding periods. Consult official guidance from IRS resources for reporting requirements on digital asset transactions. Similarly, SEC investor information outlines disclosure obligations that may apply to larger positions or frequent traders. Proper record-keeping of on-chain transactions aids compliance during frequent cycle shifts. Investors should also review state-level rules and consider consulting a tax professional before executing large reallocations to avoid unexpected liabilities.
Building Simple Dashboards for Ongoing Monitoring
Start with free on-chain explorers to track volume and flows across major chains. Add custom alerts for OBV crossovers and CVD thresholds using available API endpoints. Integrate spreadsheet formulas to flag phase changes automatically based on predefined criteria. Regular review ensures timely adjustments without complex tools. Advanced users can layer in exchange data feeds and set multi-metric dashboards that combine on-chain metrics with technical overlays for a holistic view updated daily.
Common Mistakes to Avoid in Cycle Timing
Many traders fall into predictable traps such as ignoring volume confirmation and trading solely on price breakouts. Another frequent error is over-optimizing indicators on historical data without forward-testing on live conditions. Failing to account for tax implications during rapid shifts can also erode gains. Finally, neglecting to maintain cash reserves during late accumulation stages leaves portfolios vulnerable when distribution accelerates. Awareness of these pitfalls improves long-term results.
FAQ: Common Timing Mistakes and Solutions
How do I avoid chasing false breakouts? Confirm signals with both on-chain flows and indicator alignment before acting, and wait for volume confirmation on higher timeframes.
What is the biggest dashboard oversight? Ignoring exchange-specific volume can distort true market intent and lead to misidentified phases.
How often should phases be reassessed? Weekly reviews combined with real-time alerts provide balanced monitoring without excessive screen time.
Can these frameworks work for long-term holders? Yes, they help determine optimal rebalancing points even for buy-and-hold strategies focused on multi-year horizons.
Conclusion
Mastering 2026 crypto timing through on-chain volume frameworks empowers more precise navigation of volatility. By focusing on phase identification, indicator integration, and disciplined allocation, investors position themselves for better risk-adjusted outcomes across bull and bear environments. Consistent application of these methods builds confidence and improves decision quality over multiple market cycles.

No comments yet. Be the first!