 CryptoChain Blog
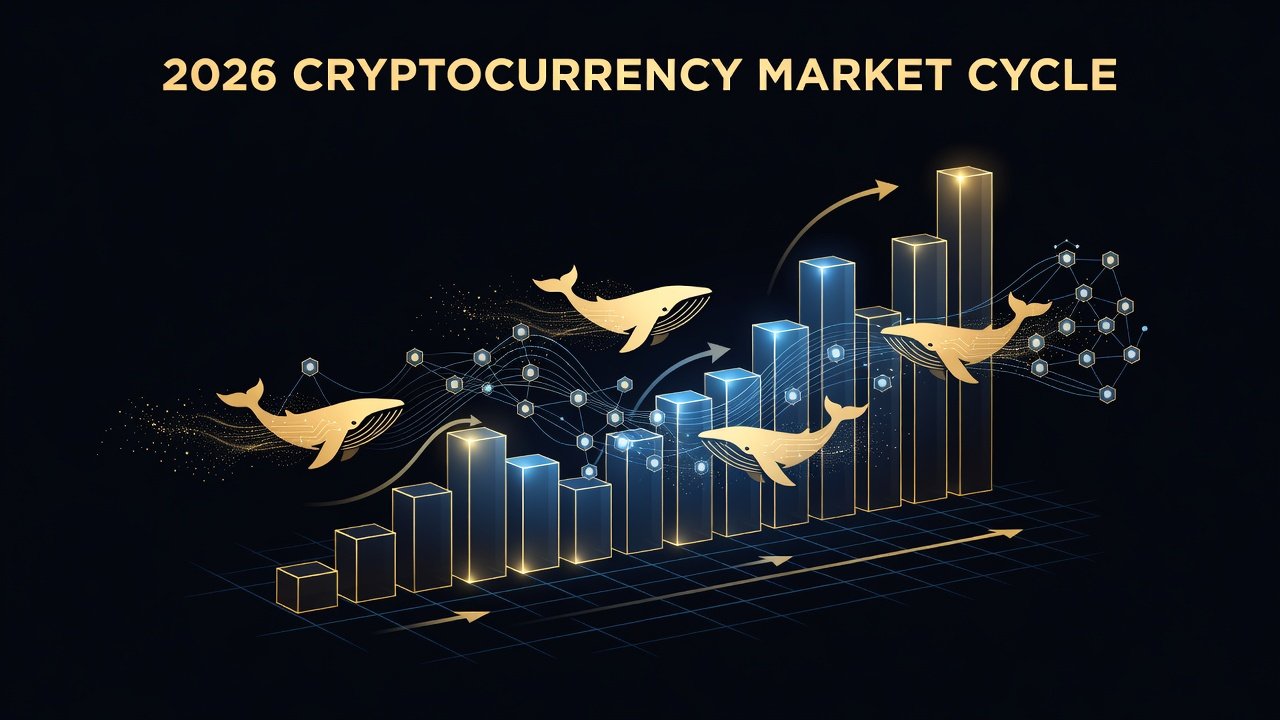
Introduction to 2026 Crypto Cycle Timing
Intermediate traders aiming for precise market entries in the 2026 bull cycle need to shift focus from simple price action to sophisticated on-chain analysis. Volume patterns and whale signals offer concrete frameworks that historically deliver superior timing compared to generic trend overviews. This comprehensive guide explores exchange inflows, realized volume, funding rates, and active address spikes in detail, providing step-by-step examples, historical phase comparisons, portfolio case studies, and risk management strategies. By mastering these metrics, traders can build repeatable checklists that align entries with cycle phases while navigating volatility effectively.
Core On-Chain Metrics for Cycle Timing
On-chain data reveals underlying network activity invisible on traditional charts. Exchange inflows typically indicate potential selling pressure when large holders transfer assets to trading venues. Realized volume captures genuine economic transfers by valuing coins at their last on-chain movement price. Funding rates in derivatives markets expose sentiment extremes, and active address spikes highlight growing user engagement. Together these form a multi-layered timing system.
Exchange Inflows and Whale Movements
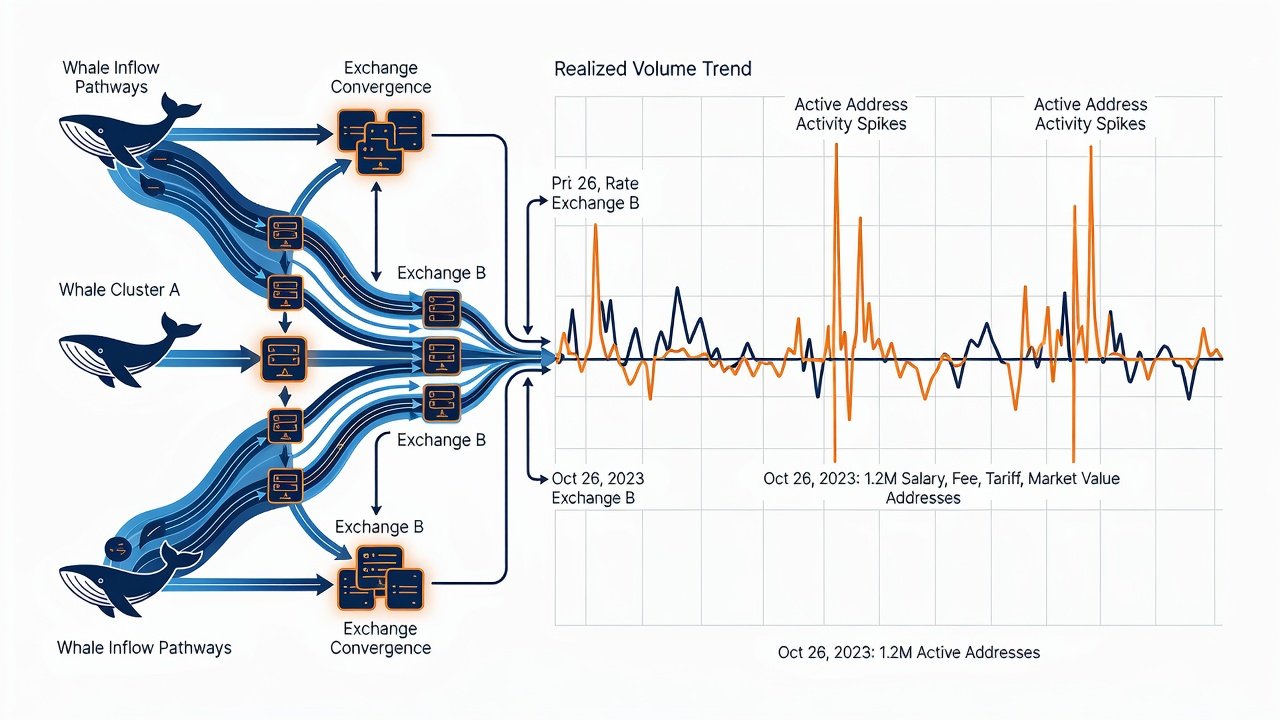
Whale activity often precedes major shifts. Large wallets moving Bitcoin or Ethereum to exchanges can foreshadow distribution. To implement this, monitor labeled whale clusters and set alerts for inflows above significant thresholds within short timeframes. Cross-reference with declining exchange reserves for accumulation signals. Historical data from prior cycles shows that sustained whale outflows combined with falling inflows marked the start of strong uptrends in 2020 and 2024 phases.
Step-by-step example: First identify whale wallets using clustering algorithms. Second, track daily inflow volumes. Third, correlate with price action to filter noise. Fourth, confirm with secondary metrics like realized volume before executing trades.
Realized Volume and Funding Rates Analysis
Realized volume distinguishes between speculative noise and actual holder behavior by only counting coins transferred at their realized price basis. Expansions in this metric during sideways price action frequently signal building momentum. Funding rates, meanwhile, turn sharply positive in late-stage euphoria and deeply negative near local bottoms, offering contrarian opportunities when aligned with other indicators.
Practical application involves comparing current realized volume levels to equivalent points in past cycles. When funding rates hover below neutral for extended periods alongside rising network metrics, the setup strengthens conviction for long positions. Traders should also watch for divergences where price rises but realized volume contracts, indicating weakening participation.
Active Address Spikes and Historical Comparisons
Daily active addresses serve as a proxy for organic demand. Spikes exceeding 20 percent from monthly averages often precede trend accelerations. Comparing 2026 patterns to 2020-2021 reveals that address growth during consolidation phases accurately predicted breakout rallies. In contrast, address declines during price pumps warned of exhaustion in 2021.
Detailed phase mapping shows early cycle accumulation features low but rising addresses, mid-cycle acceleration brings consistent spikes, and late-cycle distribution sees erratic fluctuations. Use these benchmarks to position 2026 entries relative to current network health.
Building an Actionable Timing Checklist
Combine metrics into a repeatable process. Begin by assessing whale flow direction over seven days. Next evaluate realized volume against 30-day and 90-day averages. Then review funding rate averages across major perpetual pairs. Finally confirm active address momentum and map against historical cycle stages. Only proceed with allocation when at least three of four signals align.
- Whale inflows slowing or reversing
- Realized volume expansion confirmed
- Funding rates showing mean reversion
- Active addresses accelerating
- Alignment with cycle phase data
This structured approach reduces emotional decisions during volatile periods.
Portfolio Case Studies
One mid-2025 case involved entering positions after whale inflows dropped sharply while active addresses climbed steadily. The portfolio allocated gradually across Bitcoin and select altcoins, achieving favorable risk-reward as the cycle advanced. A second example avoided a local top by observing persistent positive funding rates coinciding with large exchange deposits from known whale entities, prompting reduced exposure ahead of a correction. A third study demonstrated how conflicting signals were resolved by prioritizing realized volume trends, leading to a successful re-entry after temporary volatility subsided.
Tools, Data Sources, and Common Mistakes
Access reliable dashboards from providers focused on on-chain intelligence. Avoid over-reliance on single metrics or ignoring macro context. Common errors include chasing every address spike without volume confirmation and neglecting funding rate extremes during low-liquidity weekends. Always maintain position sizing discipline and review data across multiple timeframes.
Additional insights are available from established resources such as glassnode.com, bitcoin.org, and ethereum.org.
Risk Warnings
Even robust frameworks face limitations during black-swan events or regulatory shocks. Conflicting signals require patience rather than forced trades. On-chain data can lag in fast-moving markets and should complement rather than replace broader research. Implement stop-losses and diversification regardless of signal strength.
FAQ on Interpreting Conflicting Signals
How should traders handle rising inflows alongside positive funding rates?
Examine realized volume first. Inflows without matching realized selling often prove neutral, allowing continuation if other metrics support the trend.
What does an active address spike during price declines indicate?
Segment by address age cohorts. New address creation points to fresh participation and potential bottoms, while older addresses moving may signal distribution.
Can these metrics predict exact cycle tops?
No single indicator offers precise tops. Convergence of multiple warnings provides higher probability zones for risk reduction instead of exact timing.
How frequently should checklists be reviewed?
Daily monitoring works for active traders, while weekly reviews suit longer-term allocators. Adjust frequency based on portfolio size and market conditions.
Mastering these techniques prepares traders for informed 2026 participation.
Conclusion
Volume patterns and whale signals deliver actionable precision for 2026 crypto cycle timing. Through detailed metric integration, historical benchmarking, and disciplined checklists, intermediate traders gain concrete strategies that improve entry accuracy while mitigating common pitfalls. Consistent application combined with prudent risk controls maximizes the value of on-chain intelligence throughout the cycle.
No comments yet. Be the first!