 CryptoChain Blog
Introduction to 2026 Crypto ETF Inflows and On-Chain Timing
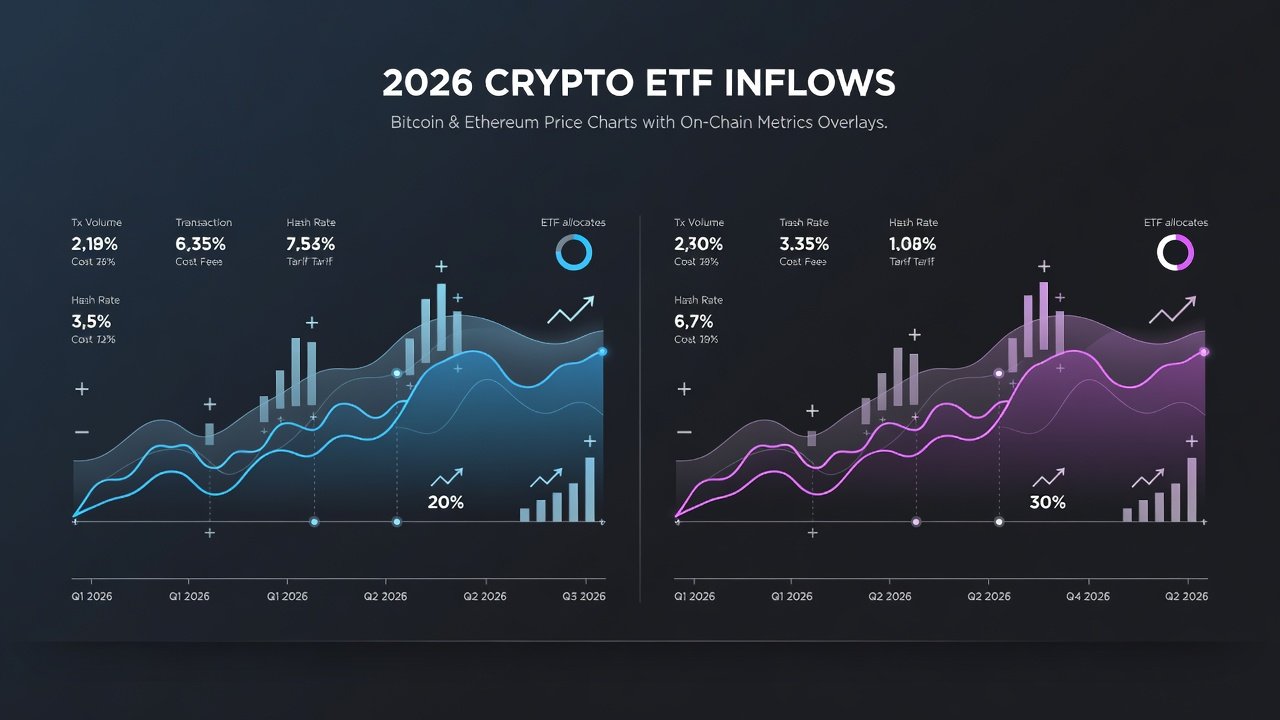
Investors in 2026 are increasingly turning to ETF inflow data as a leading indicator for market movements. When paired with on-chain metrics, these flows reveal precise entry points during rotations between Bitcoin, Ethereum, and altcoins. This approach builds on established cycle timing strategies by adding real-time blockchain transparency that was less accessible in prior years. ETF inflows represent capital entering regulated products backed by actual crypto holdings, often from institutional sources seeking compliant exposure. Tracking them alongside metrics like realized price, exchange reserves, and active addresses helps distinguish sustainable trends from short-term noise created by retail speculation or derivatives leverage.
The 2026 landscape features expanded ETF options across multiple jurisdictions, making inflow tracking more granular than ever. Historical parallels from 2024-2025 show that ignoring on-chain confirmation led to mistimed entries during rotations, while integrated analysis improved risk-adjusted returns substantially.
Bitcoin and Ethereum Flow Correlations
Bitcoin ETF inflows often lead broader market sentiment due to its dominant market share and role as a macro proxy. In early 2026, periods of strong Bitcoin ETF accumulation correlated closely with rising realized prices on-chain, where the average cost basis of holders increased steadily. Ethereum flows tend to follow with a lag of one to three weeks, signaling potential rotation opportunities once Bitcoin stabilizes and capital seeks higher-beta opportunities.
Monitoring the ratio of Bitcoin to Ethereum ETF inflows provides early signals of capital shifting between the two assets. On-chain data such as Ethereum's active validator count, staking ratios, and gas usage can confirm whether inflows are translating into genuine network usage rather than mere price speculation. For deeper correlation analysis, investors can compare weekly inflow deltas against changes in Bitcoin's illiquid supply metric and Ethereum's total value locked in DeFi protocols.
Altcoin Rotation Patterns and Liquidity Shifts
After major Bitcoin and Ethereum inflows peak, liquidity frequently rotates into altcoins with strong fundamentals or narrative momentum. On-chain indicators like token velocity, holder distribution changes, and whale wallet movements help identify which sectors are attracting capital next. Liquidity shifts appear first in stablecoin flows moving from centralized exchanges to altcoin-specific wallets, often visible through rising transfer volumes on networks like Solana or Avalanche.
Investors can watch for rising exchange inflows of specific tokens combined with decreasing Bitcoin dominance on-chain. Common patterns include rotations into layer-2 scaling solutions during Ethereum strength or into AI-related tokens when broader risk appetite increases. Practical observation shows that altcoin rotations accelerate when Bitcoin's realized price plateaus while ETF inflows remain positive but decelerating.
Realized Price Benchmarks for Entry Decisions
Realized price, calculated as the average acquisition cost of all coins based on on-chain transaction history, serves as a critical benchmark for valuation. When ETF inflows push spot prices above realized price levels, it often marks the start of new accumulation phases rather than distribution tops. For Bitcoin, this metric has historically acted as dynamic support during bull phases, while Ethereum's realized price incorporates staking rewards and layer-2 activity for added nuance.
Comparing current market price to realized price across Bitcoin and Ethereum helps filter out false breakout signals during high-inflow periods. Advanced users layer in additional on-chain data such as spent output profit ratio (SOPR) to gauge whether new capital is entering profit or loss positions, providing a more complete picture for timing decisions.
Practical Steps for Building a Simple Monitoring Dashboard
- Collect daily ETF inflow data from official filings and aggregate sources, focusing on net creations and redemptions rather than just AUM changes.
- Integrate on-chain metrics such as realized price, exchange reserves, active addresses, and stablecoin flows from public blockchain explorers and APIs.
- Set automated alerts for divergences between inflow volume and on-chain activity, such as large inflows without corresponding exchange outflows.
- Visualize correlations using basic charting tools or spreadsheet software to highlight rotation signals across asset classes.
- Backtest signals against historical 2025-2026 data to refine thresholds and avoid overfitting to recent conditions.
- Incorporate multi-timeframe views, including daily inflows versus weekly on-chain trends, for better context on sustained movements.
Real 2026 Case Examples of Inflow-Driven Rotations
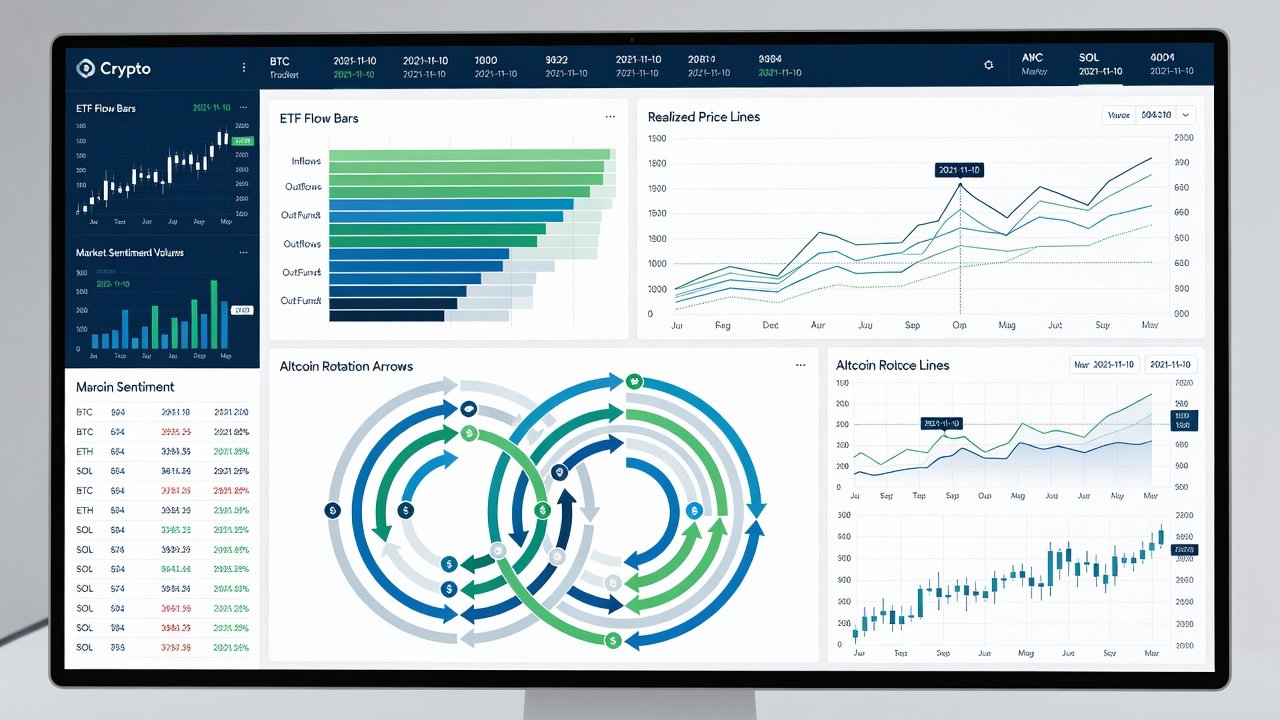
In Q1 2026, a surge in Bitcoin ETF inflows coincided with a steady rise in realized price, followed by Ethereum inflows accelerating approximately two weeks later as staking participation increased. Altcoin rotations into DeFi tokens appeared once Ethereum's on-chain fees stabilized and liquidity migrated to layer-2 solutions. Mid-year, combined ETF inflows across Bitcoin and Ethereum exceeded prior monthly averages, confirmed by declining Bitcoin exchange reserves and rising altcoin wallet accumulation on secondary chains.
Another notable case in late Q2 2026 showed rapid liquidity shifts after Bitcoin inflows paused while Ethereum flows remained elevated, leading to outperformance in select altcoins with strong on-chain holder growth. These examples illustrate how cross-referencing inflow data with realized price and reserve metrics can pinpoint rotation windows with higher precision than price action alone.
Comparing Inflow Signals Versus Traditional Volume Indicators
Traditional trading volume can be inflated by wash trading, derivatives activity, or short-term speculation that does not reflect underlying ownership changes. ETF inflows, tied directly to share creation and backed by actual cryptocurrency purchases, offer a cleaner view of institutional demand. On-chain metrics add further validation by showing whether new capital is moving coins off exchanges into long-term storage.
Inflow signals have demonstrated stronger predictive power for multi-week trends compared to spot volume spikes alone. However, the most robust approach combines both: using volume for short-term confirmation and ETF plus on-chain data for directional bias. This hybrid method reduces false positives common in high-volatility environments.
Frameworks for Stress-Testing Portfolios During High-Inflow Periods
- Simulate scenarios where inflows reverse abruptly by modeling drawdowns of varying severity and duration based on historical outflow patterns.
- Assess correlation breakdowns between assets using on-chain holder concentration data and realized price divergences.
- Establish position sizing rules based on the distance between current price and realized price levels to maintain disciplined exposure.
- Rebalance only when multiple on-chain and inflow indicators align, avoiding reactive trades driven by single data points.
- Include liquidity stress tests that factor in potential delays in ETF redemptions during extreme market stress.
- Review portfolio beta to Bitcoin dominance metrics on-chain to ensure diversification remains intact during rotations.
FAQ on Common Timing Mistakes
How do I avoid chasing inflows too late?
Focus on divergences between inflows and on-chain activity rather than absolute inflow numbers, and set alerts for early confirmation signals like reserve drawdowns.
Should I ignore traditional volume completely?
No, combine it with ETF and on-chain data for confirmation rather than relying on volume in isolation, as volume can provide intraday context that inflows lack.
What is the biggest risk during high-inflow periods?
Over-leveraging without stress-testing for sudden outflow reversals can amplify losses, especially when realized price metrics begin to flatten.
How often should I review my dashboard?
Daily checks for inflows paired with weekly deep dives into on-chain trends strike an effective balance for most investors.
Conclusion
Combining 2026 ETF inflow tracking with on-chain metrics equips investors with a robust framework for navigating market rotations. By following the practical steps, detailed case studies, and stress-testing frameworks outlined, readers can convert raw data into actionable insights that improve entry timing and portfolio resilience. This integrated method transforms ETF data from a lagging headline into a measurable advantage for identifying trend shifts across Bitcoin, Ethereum, and altcoins. For further reference, explore resources on the SEC website, Ethereum.org, and Bitcoin.org for foundational market structure details.

No comments yet. Be the first!