 CryptoChain Blog
Introduction to Stacking On-Chain Indicators for 2026
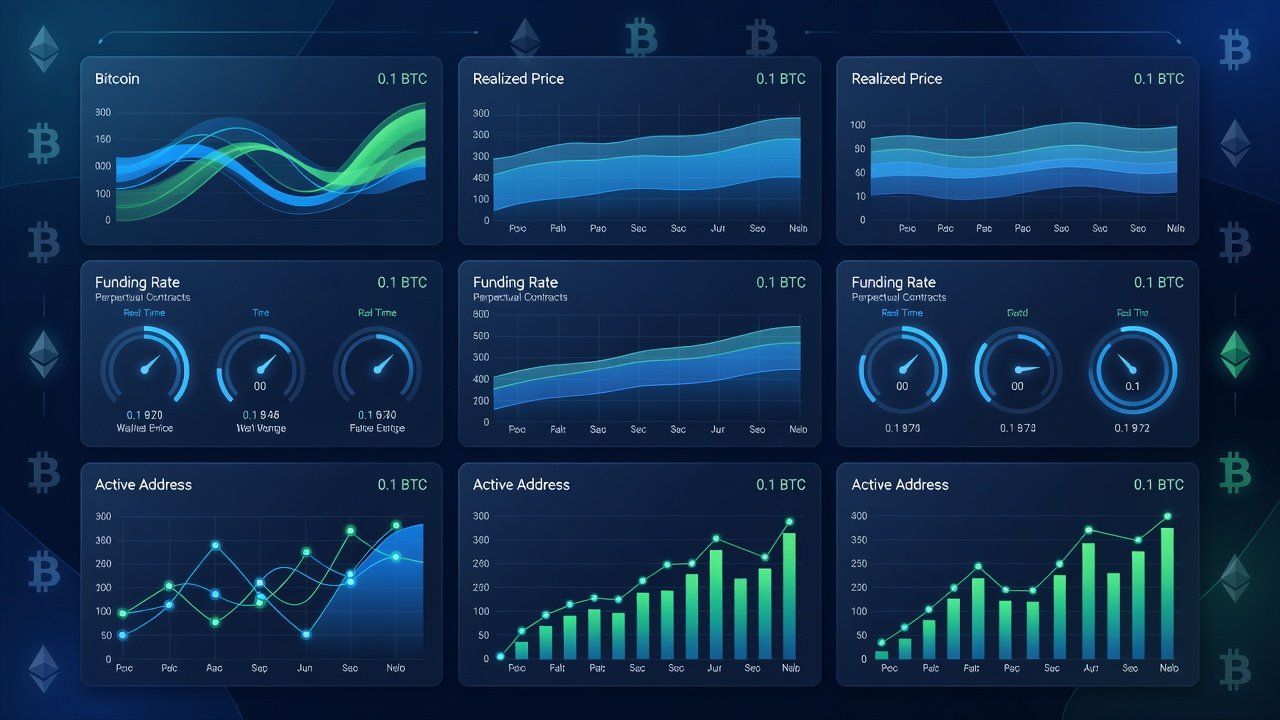
Timing cryptocurrency market entries and exits in the 2026 cycle requires moving beyond single metrics. Stacking multiple on-chain indicators creates a robust framework that filters noise and highlights high-probability zones. This approach combines exchange flows, realized price bands, funding rates, and active address trends to guide decisions with greater precision. Traders who rely on isolated signals often miss context during volatile periods when external factors like regulatory news or macroeconomic shifts influence price action. By layering data sources, you gain confirmation across market participants, derivatives sentiment, and network activity. The result is a practical system adaptable to Bitcoin, Ethereum, and major altcoins that helps identify accumulation phases early and avoid late-stage distribution traps. In previous cycles, traders using stacked signals captured larger portions of upward moves while reducing drawdowns compared to those following price action alone.
Core On-Chain Metrics Explained
Exchange Flows
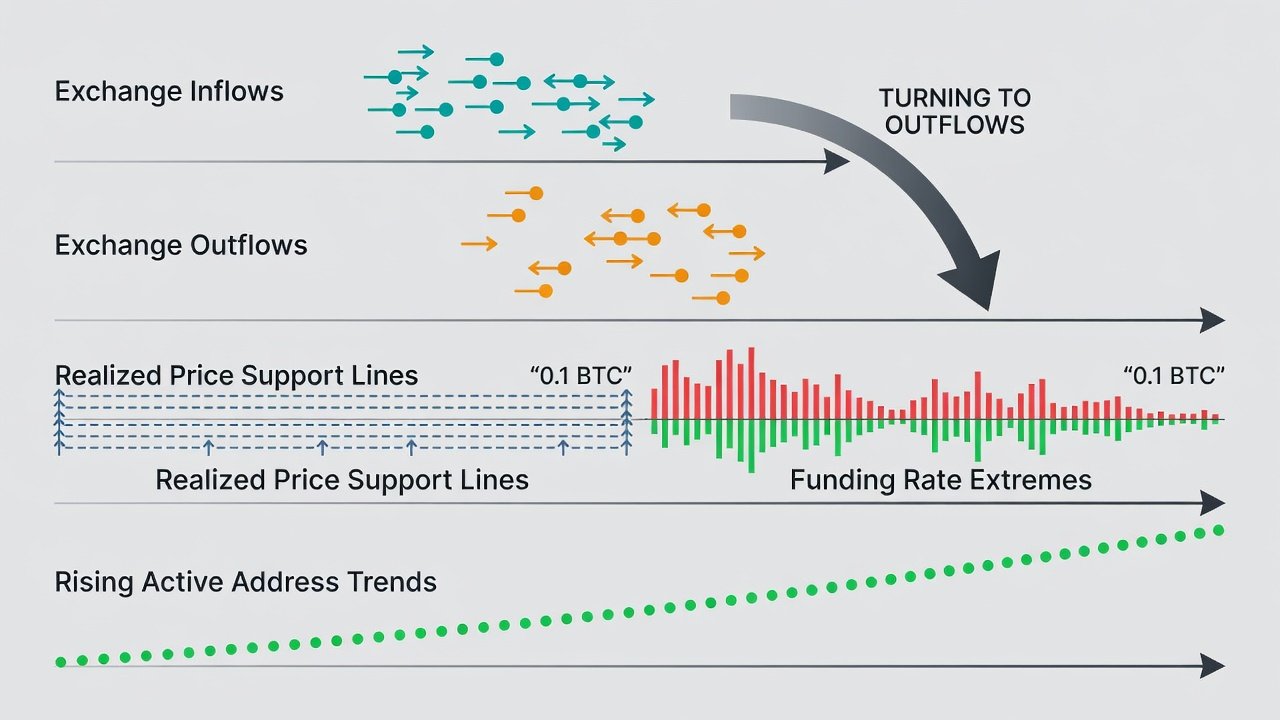
Exchange inflows and outflows reveal accumulation or distribution phases. Large inflows to exchanges frequently precede selling pressure, while outflows suggest long-term holding by whales and institutions. Monitor 30-day moving averages of net flows for clearer signals and compare them against historical cycle averages. For instance, sustained outflows above certain thresholds have historically marked the start of multi-month rallies across major assets. Understanding the difference between spot exchange flows and those involving derivatives platforms adds another layer of insight.
Realized Price Bands
Realized price represents the average cost basis of coins last moved. Bands around this metric, such as the 0.5x to 2x multiples, historically mark cycle bottoms and tops. These levels act as dynamic support and resistance that adapt as new transaction data arrives. Traders often watch when price trades below the lower band during capitulation or above the upper band during euphoria. Combining realized price with exchange flow data helps confirm whether a band breach is likely to hold or fail.
Funding Rates
Perpetual futures funding rates show leverage sentiment. Positive rates indicate bullish overcrowding that can lead to liquidations, while negative rates signal fear and potential short squeezes. Extreme readings often coincide with reversals when confirmed by spot metrics and on-chain accumulation. Monitoring funding rate percentiles over 90 days provides context beyond daily spikes.
Active Address Trends
Daily active addresses measure network usage and organic interest. Rising addresses during price consolidation point to fundamental growth, whereas declining activity during rallies may warn of weak hands and fading participation. Segmenting addresses by size, such as focusing on those above 0.1 BTC, filters out noise from small speculative wallets.
Step-by-Step Stacking Framework
Building a reliable signal requires following a logical sequence rather than checking metrics randomly. Begin with exchange flows to identify potential supply shifts in the market. Next, overlay realized price bands to locate value zones relative to historical cost basis. Then check funding rates for sentiment extremes that could accelerate or stall moves. Confirm with active address growth to ensure network fundamentals support the price action. Finally, validate the entire stack using volume patterns on spot exchanges. This sequence reduces false positives by requiring multi-metric alignment before committing capital. Re-evaluate the stack whenever any single component shifts significantly.
Volume Pattern Confirmation
Volume spikes on breakouts or breakdowns add conviction to the stacked signals. Look for rising volume alongside improving on-chain readings during accumulation phases. Low volume during apparent recoveries often signals weak hands and potential failure of the move. Compare current volume profiles against the same phase in prior cycles to gauge relative strength. Divergences between volume and on-chain metrics serve as early warnings to tighten risk parameters.
Risk Management Rules
- Never enter without at least three stacked confirmations from the core metrics.
- Set position sizes based on distance to the nearest realized price band to account for volatility.
- Use stop-losses below key outflow reversal levels identified in historical data.
- Reduce exposure when funding rates reach historical extremes without supporting flows or address growth.
- Reassess the entire stack weekly as new on-chain data emerges and market conditions evolve.
- Maintain a trading journal logging each stacked signal outcome to refine thresholds over time.
- Avoid over-leveraging even when all metrics align perfectly, as black swan events can override on-chain patterns.
Real-Scenario Walkthroughs Adapted to 2026 Conditions
Consider the 2020-2021 cycle where exchange outflows accelerated alongside rising active addresses. Realized price bands held support near previous cycle lows before a strong uptrend developed. Funding rates remained moderate until late-stage euphoria created overcrowding. Applying this to 2026, monitor similar outflow clusters near current realized price supports while watching for address growth above one million daily for Bitcoin. The second scenario draws from the 2018-2019 bear market bottom. Funding rates turned deeply negative as exchange inflows peaked, yet active addresses stabilized then rose steadily. Stacking these signals in today's environment suggests watching for negative funding combined with slowing inflows as an entry trigger, provided volume confirms the reversal and realized price bands align. These adapted examples illustrate how the same stacking logic transfers across cycles when adjusted for current network scale and liquidity levels.
Practical Tools and Data Sources
Implementing this framework requires access to reliable on-chain data platforms. Several established providers offer dashboards and APIs that aggregate exchange flows, realized prices, funding rates, and address activity. Cross-referencing multiple sources helps verify accuracy and catch discrepancies early. Many traders combine these tools with custom alerts to receive notifications when stacked conditions are met.
Common Timing Mistakes and How to Avoid Them
FAQ
Q: Why do single metrics fail during cycle transitions?
A: Isolated indicators often produce whipsaws during uncertain periods; stacking filters out noise by requiring consensus across multiple data points before acting.
Q: How frequently should I review these stacked signals?
A: Daily checks suffice for most traders, with deeper weekly reviews incorporating volume trends and realized price band updates to stay ahead of shifts.
Q: Can this framework apply to altcoins?
A: Yes, adapt the same metrics using chain-specific data from networks like Ethereum, adjusting thresholds for lower liquidity and different holder behaviors.
Q: What role does macroeconomic context play?
A: On-chain signals remain primary for timing, but cross-reference with broader liquidity conditions and interest rate environments for additional edge during major policy changes.
Q: How long does it take to master the stacking process?
A: Most dedicated analysts become proficient within several market cycles by consistently logging signals and reviewing outcomes against actual price movements.
By consistently applying this stacked approach, traders position themselves for clearer 2026 cycle decisions grounded in verifiable data rather than speculation. Glassnode, CryptoQuant, and Chainalysis provide the raw data feeds and analytical tools needed to implement these strategies effectively across different assets and timeframes.


No comments yet. Be the first!