 CryptoChain Blog

Introduction: ETF Inflows Reshaping the 2026 Crypto Landscape
The surge in crypto ETF inflows throughout 2026 has fundamentally altered market dynamics, creating new opportunities and risks for traders and investors. On-chain data now serves as a critical lens for understanding these shifts, revealing liquidity movements that traditional price charts often obscure. This article examines the interplay between ETF capital and metrics such as exchange flows, realized volume, and funding rates, offering actionable frameworks to time market entries and altcoin rotations. As institutional money continues to pour into regulated products, retail participants must learn to read the underlying blockchain signals to stay ahead of volatility spikes and liquidity rotations. Without this knowledge, even sophisticated traders risk missing the nuanced patterns that separate short-term noise from durable trends.
Key On-Chain Signals Driving ETF Impact
Exchange flows provide the clearest window into institutional behavior. When large volumes move off exchanges following ETF approvals, it signals reduced selling pressure and potential accumulation phases. These flows are especially telling when tracked daily across major custodians. Realized volume, which tracks the actual economic value transferred on-chain rather than notional trading, highlights genuine demand behind price moves and helps differentiate between speculative trading and long-term holding. Funding rates on perpetual futures contracts further indicate leverage conditions, with persistent positive rates often coinciding with ETF-driven rallies that attract additional speculative capital.
These signals gain power when tracked together. For instance, declining exchange reserves paired with rising realized volume and neutral funding rates frequently precede sustained uptrends fueled by ETF capital. In 2026, analysts observed that Bitcoin exchange outflows accelerated sharply after new spot ETF launches, while Ethereum flows showed more sensitivity to DeFi protocol activity.
Exchange Flows Deep Dive
Net exchange flows measure the difference between coins entering and leaving custodial wallets. Large negative flows (outflows) typically indicate accumulation by long-term holders or ETF custodians. In practice, monitoring 7-day and 30-day moving averages helps filter out daily noise.
Realized Volume Explained
Unlike spot trading volume, realized volume only counts transactions where the economic value changes hands at the current price. Spikes here often align with ETF settlement periods and can precede altcoin rotations when capital seeks higher-beta opportunities.
Funding Rates as Sentiment Gauges
Funding rates reflect the cost of holding leveraged positions. Elevated positive rates suggest overcrowding on the long side, which can lead to sharp corrections if ETF inflows suddenly slow.
Step-by-Step Framework for Interpreting Signals
- Monitor exchange net flows using dashboards that aggregate Bitcoin and Ethereum wallet movements across the top ten exchanges; set alerts for deviations beyond two standard deviations from the 30-day mean.
- Cross-reference with realized volume spikes to confirm whether inflows represent new capital or internal reshuffling; look for volume that exceeds the previous month average by at least 40 percent.
- Check funding rates across major perpetual markets to gauge leverage sustainability; avoid entries when rates exceed 0.05 percent daily without corresponding on-chain accumulation.
- Layer in ETF-specific flow data to correlate institutional entries with on-chain changes; compare weekly ETF reports against blockchain metrics for confirmation.
- Identify rotation opportunities when altcoin realized volumes begin rising relative to Bitcoin dominance metrics; target assets with improving exchange outflow trends and neutral funding rates.
This structured approach helps distinguish noise from signal, enabling more precise timing for both spot and leveraged positions. Traders who applied this method in Q1 2026 successfully rotated into mid-cap altcoins ahead of a 25 percent sector rally.
2026 Case Studies: Bitcoin and Ethereum ETF Comparisons
Bitcoin ETF inflows in early 2026 demonstrated strong correlation with reduced exchange outflows, leading to lower volatility as institutional holders locked coins away. Daily average outflows reached multi-month highs, supporting a steady price climb with limited drawdowns. In contrast, Ethereum ETF activity showed higher realized volume sensitivity, with liquidity rotating into Layer-2 ecosystems and DeFi protocols. These differences underscore how asset-specific on-chain responses can guide portfolio allocation decisions.
One notable example occurred in March 2026 when Bitcoin ETF inflows coincided with a 15 percent reduction in exchange reserves over two weeks, accompanied by stable funding rates near zero. Ethereum, meanwhile, saw realized volume surge 65 percent during the same period, yet funding rates climbed into positive territory, signaling potential over-leverage. The divergence allowed nimble investors to reduce Bitcoin exposure and increase allocations to Ethereum-related altcoins before the next leg higher.
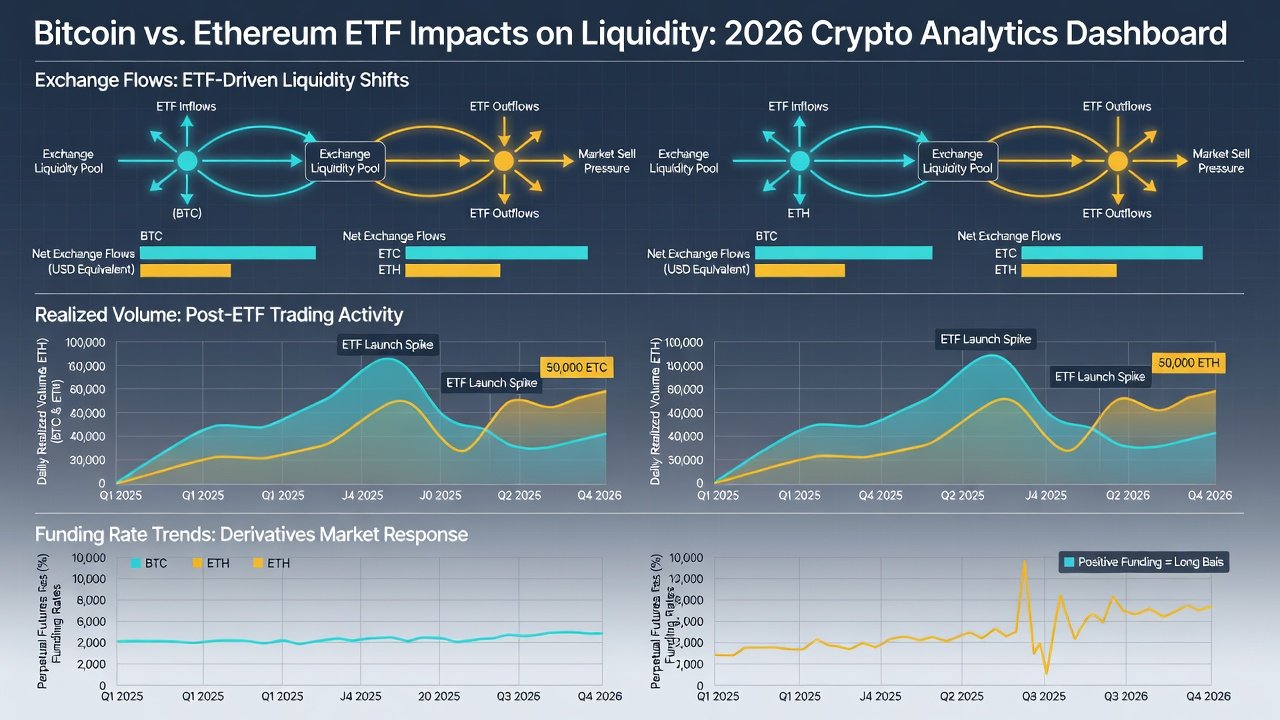
Comparing the two reveals that Bitcoin benefited from steadier accumulation patterns, while Ethereum experienced sharper volatility spikes during inflow surges, creating tactical entry windows for altcoin exposure. Another case in July 2026 showed how combined signals across both assets helped institutions rebalance portfolios ahead of regulatory announcements.
Practical Tools, Dashboards, and Risk Checks
Retail and institutional participants benefit from combining platforms like Glassnode for on-chain analytics with official regulatory filings available at SEC.gov. Additional dashboards tracking funding rates and realized capitalization provide real-time alerts when thresholds are breached. Traders should also incorporate data from established on-chain providers that offer API access for custom alerts. Always implement risk checks such as position sizing limits capped at 5 percent of portfolio per signal cluster, multi-signal confirmation rules requiring at least three aligned metrics, and stop-loss thresholds tied to exchange flow reversals exceeding 10,000 BTC or 50,000 ETH in a single day.
Common Mistakes to Avoid and Portfolio Adjustments
Many market participants overlook the lag between ETF flow reporting and on-chain settlement, leading to premature entries. Another frequent error is ignoring altcoin-specific realized volume when Bitcoin dominance is high. To adjust portfolios effectively, maintain a core Bitcoin and Ethereum allocation while using 15-25 percent satellite positions in altcoins only when all three primary signals align. Rebalance quarterly or when any single metric diverges significantly from its 30-day average.
Conclusion
Mastering on-chain signals behind 2026 ETF inflows equips investors with a data-driven edge. By systematically analyzing flows, volume, and funding dynamics, market participants can navigate rotations into altcoins while managing downside exposure effectively. The frameworks and case studies presented here provide a repeatable process for both retail traders and larger institutions seeking to optimize timing and risk management.
FAQs
How do ETF inflows affect exchange flows?
ETF inflows typically reduce available supply on exchanges as custodians move assets off-platform, lowering immediate sell pressure and often coinciding with price stability or gradual appreciation over subsequent weeks.
What realized volume threshold indicates strong demand?
Sustained increases above recent averages, confirmed across multiple chains, often signal durable institutional interest rather than speculative noise; a practical benchmark is a 30-50 percent rise sustained for at least five consecutive days.
Are funding rates reliable for timing altcoin rotations?
They serve as useful sentiment gauges when combined with on-chain volume data, though they should never be used in isolation because external macro events can override rate signals temporarily.
How often should retail investors review these metrics?
Daily monitoring of flows and funding rates combined with weekly realized volume reviews provides sufficient coverage without creating information overload for most portfolios.
No comments yet. Be the first!