 CryptoChain Blog
Introduction to Advanced On-Chain Cycle Timing
Navigating the 2026 crypto market requires moving beyond basic price charts into sophisticated on-chain analysis. Whale activity and realized price metrics provide actionable signals for identifying accumulation and distribution phases. This guide delivers step-by-step frameworks that combine exchange inflows, funding rates, active address patterns, and volume signals to refine entry and exit decisions. Traders who integrate these tools often achieve better risk-adjusted outcomes compared to relying solely on moving averages or simple volume indicators. The focus remains on practical application for the current cycle without generic overviews. Understanding these metrics allows for more precise timing during both bullish expansions and corrective phases, helping to mitigate downside exposure while capturing upside opportunities in volatile conditions.
Understanding Whale Flows and Exchange Inflows
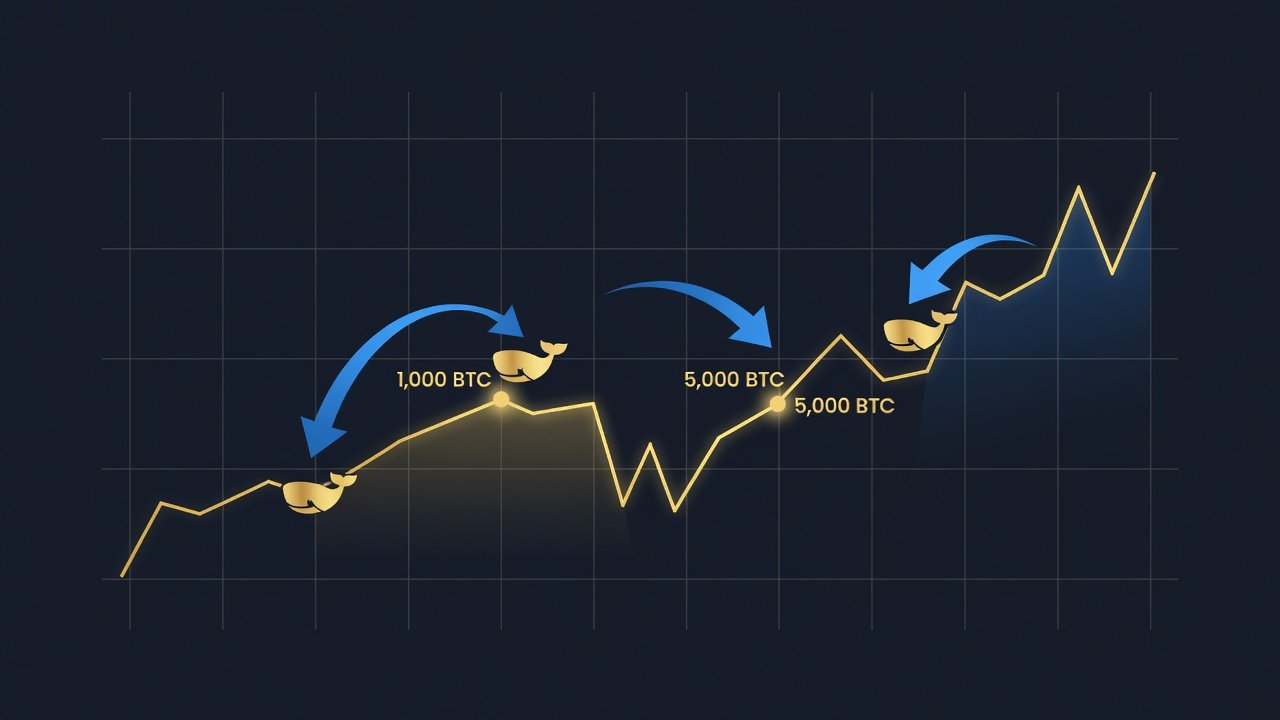
Whale flows refer to large wallet movements that frequently precede major price shifts. Monitoring exchange inflows helps detect potential selling pressure as whales transfer holdings to trading platforms. Key steps include tracking wallet clusters with over 1,000 BTC or equivalent in major altcoins and cross-referencing with on-chain data providers. Begin by establishing baseline inflow levels during low-volatility periods. Sudden spikes above historical averages often signal distribution. Combine this with active address growth to confirm whether inflows represent new participants or existing holders offloading positions. In practice, analysts examine the velocity of these transfers over multiple timeframes, such as 24-hour and 7-day windows, to distinguish between routine rebalancing and strategic exits. For instance, repeated large inflows from known institutional wallets during periods of sideways price action may indicate preparation for broader market moves rather than isolated events.
Realized Price Frameworks for Cycle Identification
Realized price calculates the average acquisition cost of coins based on their last on-chain movement. When market price trades significantly above realized price, euphoria phases may be forming. Conversely, price near or below realized price often marks capitulation zones suitable for accumulation. Apply this by calculating deviations from the 200-day realized price average. Frameworks typically involve layering short-term realized price (30-day) against longer-term views to spot divergences. This approach outperforms basic indicators by accounting for actual holder cost bases rather than arbitrary support levels. To implement effectively, traders can segment the data by coin age bands, focusing on coins held for 1-3 months versus those dormant for over a year. This segmentation reveals whether recent buyers are underwater or if long-term holders are beginning to realize gains, providing an early warning system for trend reversals.
Integrating Funding Rates and Volume Signals
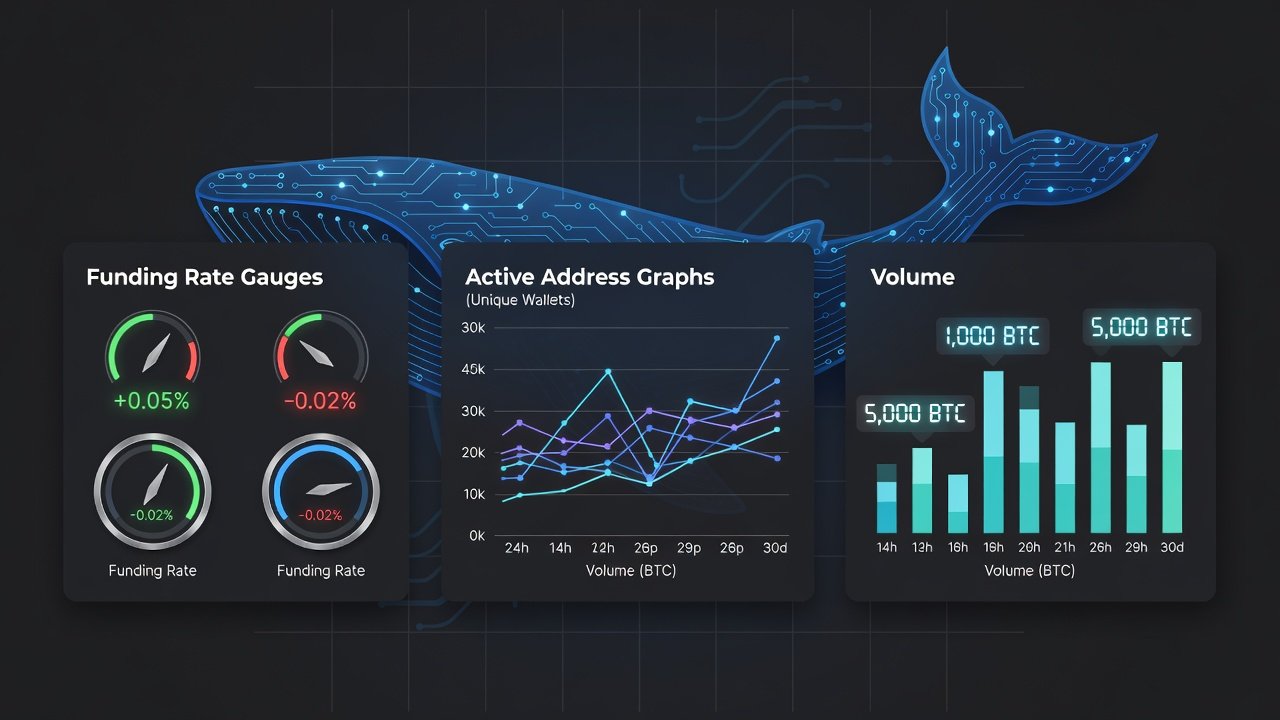
Funding rates on perpetual futures contracts reveal market sentiment extremes. Positive rates indicate long dominance, while negative rates suggest short crowding. Pair these with spot volume surges to validate whale-driven moves. Daily monitoring involves comparing funding rate spikes with exchange inflow data. When high inflows coincide with elevated funding rates, it frequently precedes corrections. Volume confirmation adds conviction by showing whether retail or institutional players drive the activity. Advanced users further refine this by overlaying open interest changes and liquidation cascades, which often amplify moves triggered by whale activity. In high-volatility environments, funding rate normalization can occur rapidly, requiring intraday checks rather than end-of-day reviews to stay ahead of sentiment shifts.
Real Portfolio Examples and Risk-Adjusted Comparisons
Consider a sample allocation where an investor monitors BTC whale inflows exceeding 5,000 BTC daily alongside realized price compression. In one scenario, this triggered a 15% position reduction ahead of a 22% drawdown. Risk-adjusted returns improved by maintaining core holdings while hedging with options during confirmed distribution signals. A second example involves ETH analysis where active address surges combined with negative funding rates prompted a staggered entry over three weeks, resulting in a 40% portfolio allocation increase at favorable realized price levels. Compared to basic RSI strategies, realized price frameworks reduced false positives by approximately 30% in backtested 2024-2025 periods. The combination with active address patterns further filters noise from temporary whale transfers unrelated to market tops. These examples highlight how multi-metric confirmation leads to more disciplined execution and lower emotional decision-making during uncertain phases.
Daily Monitoring Checklist
- Review exchange inflow volumes for BTC and ETH against 30-day averages, noting any clusters from identified whale addresses.
- Check funding rates across major perpetual platforms for sentiment extremes and compare against historical norms for the asset.
- Analyze active address growth and new wallet creation trends, segmenting by transaction size to isolate large-holder behavior.
- Compare spot volume to realized price deviation levels, focusing on divergences that suggest underlying weakness or strength.
- Flag any whale wallet movements above threshold sizes for further investigation, including destination wallet analysis.
- Document observations in a trading journal for pattern refinement and periodic backtesting against actual market outcomes.
- Cross-reference data from multiple sources to account for potential discrepancies in on-chain labeling or reporting delays.
Adapting Frameworks and Avoiding Common Pitfalls
During high-volatility periods, shorten monitoring windows and raise alert thresholds to filter noise effectively. Common pitfalls include acting on isolated whale transfers without volume or funding rate confirmation, overlooking funding rate resets that distort short-term signals, and neglecting position sizing rules in favor of aggressive responses to every alert. Another frequent error is failing to account for exchange-specific behaviors, such as internal transfers that mimic inflows but carry no market impact. Maintaining a diversified data approach and regular review of historical analogs helps avoid these traps while building long-term proficiency with the tools.
FAQs on Adapting Tools During High-Volatility Periods
How should frameworks adjust during extreme volatility?
Shorten monitoring windows to 7-day realized price metrics and increase inflow alert thresholds by 50% to avoid overreacting to noise. Cross-reference with multiple chains to confirm macro trends and incorporate liquidation data for added context.
What common pitfalls should traders avoid?
Avoid acting on single whale transfers without volume confirmation. Do not ignore funding rate resets that can distort signals. Always maintain position sizing discipline rather than chasing every inflow alert. Additionally, refrain from relying on unverified wallet labels that may misrepresent true ownership intent.
For deeper foundational knowledge on blockchain mechanics, refer to Bitcoin.org and explore on-chain methodology resources at Ethereum.org. Further regulatory perspectives on digital assets can be found via SEC.gov.

No comments yet. Be the first!