 CryptoChain Blog
Introduction to Exchange Inflow Strategies in 2026
Crypto markets continue to evolve rapidly in 2026, with traders seeking reliable on-chain signals to navigate volatility. Exchange inflow metrics have emerged as a powerful tool for timing market cycles, offering insights into accumulation and distribution phases that traditional price charts often miss. This comprehensive guide explores practical frameworks that combine these inflows with realized price and funding rates for actionable decisions across Bitcoin and Ethereum markets. Whether you are a seasoned analyst or a newcomer to cryptocurrency analysis, understanding these metrics can provide a decisive edge in identifying when smart money is positioning for the next leg up or preparing to exit.
Understanding Exchange Inflows in Crypto Cycles
Exchange inflows represent the volume of cryptocurrency moving into centralized trading platforms from private wallets. High inflows often signal potential selling pressure as holders prepare to trade or liquidate positions, while reduced inflows during price dips can indicate accumulation by long-term holders who prefer to keep assets off exchanges. In 2026 bull runs, monitoring these flows alongside broader market sentiment has helped identify early entry points with greater precision than volume alone. On-chain data reveals that periods of declining inflows frequently coincide with the formation of local bottoms, allowing attentive traders to enter before retail FOMO drives prices higher. This dynamic underscores why inflow analysis forms a core part of modern crypto insights strategies.
Interpreting BTC and ETH Flows with Realized Price and Funding Rates
Bitcoin and Ethereum exchange flows provide nuanced signals when paired with realized price, which reflects the average cost basis of coins on the network. Low inflows coinciding with funding rates near neutral levels often precede upward moves as leveraged positions unwind without excessive speculation. Traders watch for divergences where inflows drop while realized price stabilizes, suggesting smart money is positioning ahead of rallies. For ETH specifically, monitoring staking-related outflows alongside exchange inflows adds another layer, as reduced exchange balances during accumulation phases often foreshadow protocol upgrades or ecosystem growth. Funding rates act as a sentiment gauge, with persistently negative rates combined with low inflows pointing to capitulation rather than distribution.
Step-by-Step Framework for Identifying Accumulation Phases
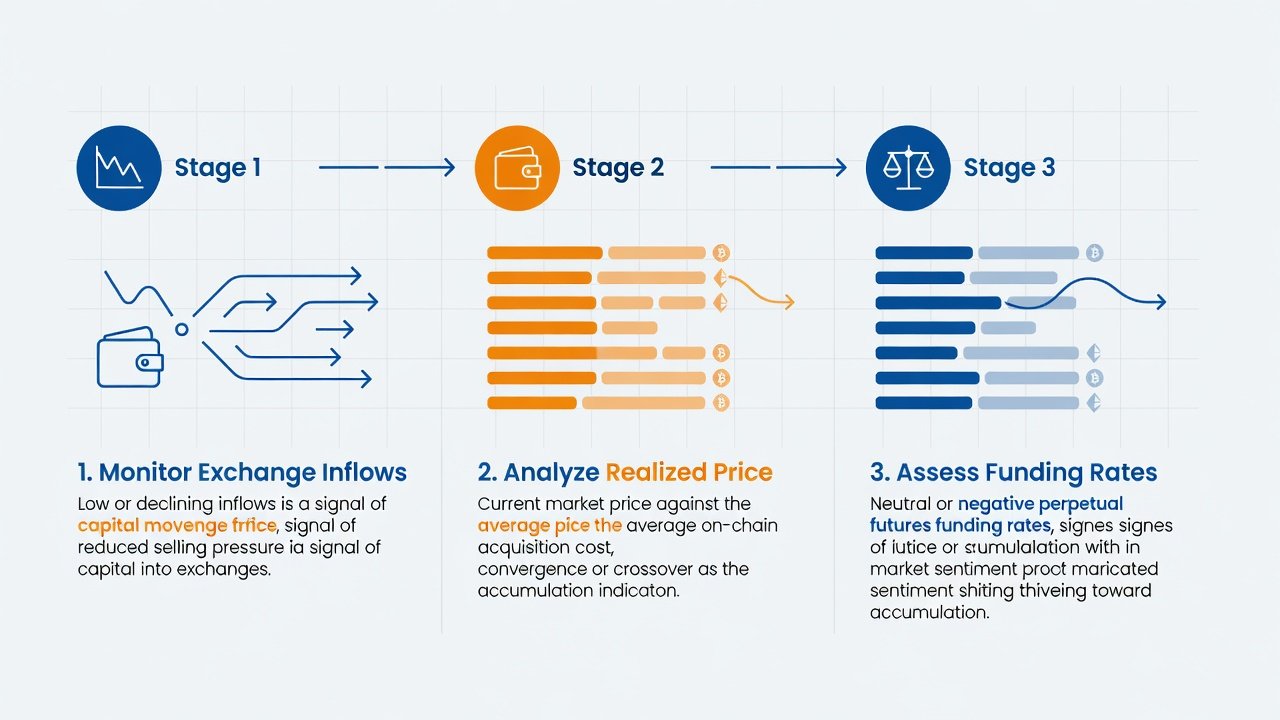
Follow this structured approach to spot accumulation using inflow data. First, track 7-day and 30-day moving averages of exchange inflows for BTC and ETH using reliable on-chain dashboards. Second, cross-reference these trends with realized price movements to confirm that holders are not realizing losses at scale. Third, monitor perpetual futures funding rates for signs of leverage exhaustion, where rates hover close to zero during price consolidation. Fourth, confirm the phase by observing declining exchange reserves over multiple weeks, which shows coins leaving trading venues. Fifth, validate the signal by noting price action that holds above key support levels despite low inflows, indicating organic demand absorption. Sixth, incorporate volume profile analysis to ensure the accumulation is not accompanied by suspicious spikes that could indicate manipulation. This multi-step process helps filter noise and provides a repeatable method for cryptocurrency analysis in fast-moving markets.
Inflow Signals Versus Traditional Volume Indicators
Traditional trading volume measures market activity but can be misleading during wash trading or low-conviction moves driven by bots. Exchange inflow signals offer a more direct view of holder behavior, distinguishing between retail-driven volume spikes and institutional accumulation. In comparisons from recent cycles, inflow-based strategies have reduced false positives by focusing on supply dynamics rather than just transaction counts. Volume may surge on news events without corresponding inflow changes, whereas genuine accumulation shows consistent reserve drawdowns. This distinction proves especially valuable in 2026 when algorithmic trading dominates short-term charts, making on-chain metrics essential for confirming sustainable trends.
2026 Case Studies from Recent Bull Runs
During the early 2026 bull phase, BTC saw sustained low inflows while price consolidated above realized levels, preceding a strong leg higher that lasted several weeks. ETH followed a similar pattern with funding rates compressing alongside reserve drawdowns, allowing traders who tracked these signals to build positions ahead of ecosystem announcements. Additional case studies from mid-2026 corrections showed rapid inflow spikes serving as timely exit warnings, with one notable event where ETH inflows doubled within 48 hours, coinciding with a 12 percent price reversal. These real-world examples highlight how combining metrics helped traders avoid premature entries and capture extended moves while managing downside risk effectively.
Risk-Adjusted Exit Rules
Implement these rules to manage positions with discipline. Set alerts for inflow surges exceeding 20 percent above monthly averages to flag potential distribution. Pair exits with funding rate spikes above 0.05 percent to capture over-leveraged conditions before reversals accelerate. Use trailing stops based on realized price breaches to protect gains without selling too early. Re-enter only after inflows normalize and reserves stabilize for at least one week. This risk-adjusted method has proven effective for preserving gains across volatile periods by balancing opportunity capture with capital protection.
Tools and Resources for Monitoring Inflows
Several established platforms provide real-time exchange inflow data. Traders commonly rely on analytics providers that aggregate wallet movements across major exchanges. Integrating these tools with alerts for funding rate changes creates a complete monitoring system. Cross-referencing multiple sources reduces the chance of data errors and offers a broader view of market participant behavior. For deeper cryptocurrency analysis, combining inflow data with glassnode-style metrics enhances accuracy without requiring advanced programming skills.
Beginner-Friendly Checklist
- Review daily exchange inflow charts for both BTC and ETH using trusted dashboards
- Compare inflows against 30-day averages to identify meaningful deviations
- Check realized price relative to current market price for cost basis context
- Assess funding rates across major perpetual contracts for sentiment clues
- Confirm accumulation signals with multi-week reserve trends
- Apply exit rules before committing new capital to positions
- Backtest frameworks on historical 2025-2026 data to understand patterns
- Document each trade decision with inflow notes for future review
- Combine signals with broader market news to avoid isolated misreads
- Start with small position sizes while learning the framework
FAQ
What do high exchange inflows typically mean?
High inflows often precede increased selling activity as holders move assets to exchanges for potential liquidation or trading, though context from realized price is essential to avoid misinterpretation.
How do funding rates enhance inflow analysis?
Funding rates reveal market sentiment and leverage levels, helping confirm whether inflows represent accumulation by patient buyers or distribution by short-term traders.
Can beginners use these strategies effectively?
Yes, with the checklist and step-by-step framework, beginners can start interpreting flows, though combining with multiple indicators and starting small reduces early mistakes.
Are inflow metrics reliable in all market conditions?
They perform best in trending markets; sideways or manipulated conditions require additional confirmation from realized price, reserves, and external news sources.
What common mistakes should traders avoid when reading flow data?
Avoid reacting to single-day spikes without averaging and always consider the broader cycle context rather than isolated numbers.
Conclusion
Exchange inflow strategies provide concrete tools for 2026 crypto cycle timing. By integrating BTC and ETH flows with realized price and funding rates, traders gain a robust edge for identifying accumulation and managing exits. Apply the frameworks, tools, and checklist to build disciplined, data-driven approaches that stand the test of evolving markets. For further reading on on-chain metrics, explore resources at CoinDesk, Ethereum.org, and Bitcoin.org.

No comments yet. Be the first!