 CryptoChain Blog
Introduction to Advanced Crypto Cycle Timing in 2026
Cryptocurrency markets continue to evolve rapidly, and 2026 brings new opportunities for investors who master on-chain indicators. Building on foundational cycle analysis, advanced timing techniques combine on-chain data with sentiment metrics to pinpoint market phases more accurately. This approach helps traders navigate volatility while optimizing risk-adjusted returns. Investors seeking an edge in cryptocurrency analysis must move beyond basic price action and incorporate blockchain-derived signals that reveal underlying network health and participant behavior. Emerging crypto trends in 2026 emphasize data transparency, making on-chain tools indispensable for both retail and institutional participants. Throughout this comprehensive guide, we break down identification methods, draw from historical patterns, compare market regimes, and outline frameworks that support disciplined decision-making in dynamic conditions.
Key Phases of Crypto Market Cycles
Market cycles typically progress through accumulation, markup, distribution, and markdown phases. On-chain metrics such as realized price, active addresses, and exchange reserves provide objective signals for each stage. Realized price reflects the average cost basis of all coins in circulation, offering a clearer view of holder profitability than spot prices alone. Active addresses measure daily unique participants, serving as a proxy for network adoption and usage intensity. Exchange reserves track the volume of assets held on trading platforms, with declining balances often indicating long-term holding conviction.
Step-by-Step Identification Methods
- Monitor realized capitalization to detect accumulation bottoms by comparing it against historical cycle lows and noting when it begins to stabilize alongside rising transaction counts.
- Track transaction volume spikes alongside rising active addresses for markup confirmation, ensuring these increases occur without corresponding spikes in exchange inflows that could signal short-term speculation.
- Watch for declining exchange inflows combined with high unrealized profits during distribution warnings, cross-referencing these with social sentiment cooling as an additional confirmation layer.
- Use declining network activity and rising exchange reserves to identify markdown onsets, paying close attention to sudden drops in wallet creation rates that historically precede broader sell-offs.
These steps allow investors to move beyond price charts alone and ground decisions in verifiable blockchain activity. Applying them consistently requires access to reliable dashboards and a willingness to interpret multiple data streams simultaneously rather than in isolation.
Practical Examples from Recent Cycles
During the 2024-2025 cycle, Bitcoin's realized price crossed key moving averages weeks before the major rally, providing early signals visible through platforms like Glassnode. Similarly, Ethereum's active address growth preceded altcoin rotations, illustrating how on-chain data anticipated broader market shifts. In the 2022 bear market bottom, rising stablecoin inflows to exchanges coincided with capitulation events that on-chain analysts flagged as local troughs. Looking ahead to 2026, similar patterns may emerge around Bitcoin halving effects and institutional adoption waves, where metrics such as long-term holder supply percentages could again serve as leading indicators. Investors who combined these metrics with sentiment indicators avoided premature entries during local tops and captured extended upside by waiting for full confluence across datasets.
Bull Versus Bear Dynamics: A Comparison
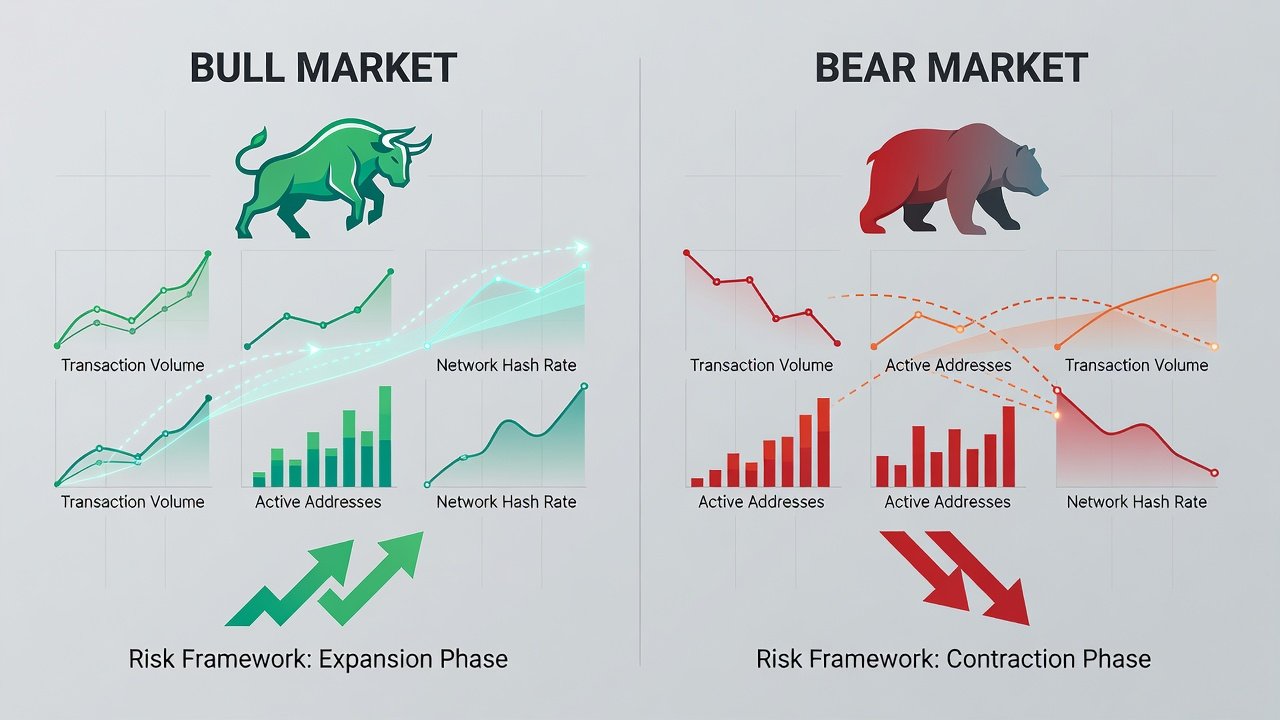
- Bull markets feature rising realized prices, expanding active addresses, and decreasing exchange balances as holders move assets to self-custody. Network growth accelerates with new wallet creation and higher transaction values per active user.
- Bear markets show contracting network activity, increasing exchange reserves, and falling transaction counts as participation wanes. Profitability metrics turn negative for most cohorts, and long-term holder supply begins to decrease as weak hands exit.
Comparing these dynamics side-by-side helps investors differentiate temporary corrections from full cycle reversals, a critical skill in 2026 cryptocurrency analysis. Additional nuances include monitoring miner revenue trends and staking participation rates on proof-of-stake networks, which provide further texture to regime identification.
Essential On-Chain Tools and Data Sources
Access to quality data underpins successful timing. Leading platforms aggregate on-chain metrics into user-friendly interfaces while offering API access for custom modeling. Cross-referencing multiple providers reduces the risk of data anomalies. Authoritative resources such as Coindesk frequently publish explanatory pieces on interpreting these datasets, while educational hubs like Investopedia offer foundational primers on metrics like MVRV and SOPR.
Integrating AI Tools for Predictive Insights
Artificial intelligence enhances on-chain analysis by processing vast datasets in real time. Machine learning models trained on historical cycle data can forecast potential turning points when fed live metrics such as MVRV ratios and SOPR. Clustering algorithms group wallet behaviors to detect accumulation patterns invisible to manual review, while natural language processing applied to social sentiment feeds quantifies crowd psychology shifts. These tools complement traditional indicators, offering probabilistic forecasts rather than deterministic predictions. In practice, combining AI outputs with on-chain thresholds creates hybrid signals that have shown improved accuracy in backtests across multiple cycles.
Risk-Adjusted Entry and Exit Frameworks
Successful timing requires structured risk management. One effective framework involves scaling positions based on confluence scores: assign points for on-chain confirmation, sentiment alignment, and AI model output. Enter only when scores exceed predefined thresholds and maintain strict stop-loss levels tied to realized price deviations. Exit strategies mirror this approach, using distribution signals to reduce exposure gradually rather than attempting to sell at exact tops. Position sizing should account for volatility regimes, with smaller allocations during low-confluence periods and larger ones when multiple indicators align. Regular portfolio reviews incorporating updated on-chain readings help maintain discipline amid emotional market swings.
Investor Case Studies
Consider a mid-sized fund that applied on-chain timing during the 2025 recovery. By entering after realized price stabilization and confirmed address growth, the fund achieved superior risk-adjusted performance compared to buy-and-hold peers. Another retail investor avoided major drawdowns by monitoring exchange reserve spikes and exiting early in distribution phases. A third example involves a quantitative trading desk that layered AI predictions atop on-chain data to time altcoin rotations, generating consistent alpha across three consecutive quarters. These examples demonstrate how disciplined application of advanced indicators translates theory into measurable results when executed with patience and ongoing refinement.
FAQ: Common Timing Mistakes to Avoid
How do I avoid false signals from on-chain data?
Always seek confluence across multiple metrics and avoid relying on single indicators. Cross-reference with macroeconomic context and sentiment trends to filter noise effectively.
Can AI tools replace human judgment in crypto timing?
No. AI provides powerful pattern recognition but should augment, not replace, fundamental analysis and risk management protocols that incorporate broader market understanding.
What is the biggest mistake new investors make with cycle timing?
Overtrading based on short-term fluctuations. Successful timing emphasizes higher-timeframe on-chain confirmation and patience during uncertain periods rather than reactive position changes.
How important is sentiment data alongside on-chain metrics?
Sentiment data adds crucial context by revealing crowd psychology that pure blockchain statistics may miss, helping confirm or contradict on-chain signals during turning points.
Should beginners start with all available indicators at once?
No. Start with core metrics like realized price and exchange reserves, then gradually incorporate additional layers as familiarity grows to prevent analysis paralysis.
Conclusion
Advanced cycle timing using on-chain indicators and sentiment data offers a robust edge for navigating 2026 crypto markets. By mastering phase identification, comparing bull and bear dynamics, integrating AI, and applying disciplined risk frameworks, investors position themselves for more consistent outcomes. Combine these strategies with ongoing education and regular tool evaluation to stay ahead of evolving crypto trends while managing downside exposure effectively.

No comments yet. Be the first!