 CryptoChain Blog

Introduction
In 2026, cryptocurrency markets continue to exhibit extreme volatility driven by rapid technological shifts, regulatory developments, and global adoption waves. Yet beneath the price swings lies a powerful force: investor psychology. Behavioral biases such as overconfidence and anchoring frequently distort cycle timing, leading traders to buy at peaks or sell at troughs. This article examines these biases through real 2026 market examples, on-chain data correlations, and technical indicator overlays. Understanding these patterns helps both retail and institutional participants improve risk-adjusted returns. We draw comparisons to traditional finance while providing actionable frameworks, checklists, and FAQs that go beyond surface-level advice.
Crypto cycles in 2026 have been shaped by unique factors including institutional inflows and evolving on-chain metrics. However, human psychology remains constant, often overriding data-driven signals. By exploring how biases manifest in practice, readers can develop strategies to counteract them effectively.
Key Behavioral Biases in Crypto Cycle Analysis
Overconfidence bias leads investors to overestimate their ability to predict market turns. In early 2026, many traders anchored to Bitcoin’s December 2025 high near cycle resistance, ignoring on-chain signals of distribution. Anchoring bias, meanwhile, causes fixation on specific price levels, such as previous all-time highs, even when fundamentals have evolved. Additional biases like herding and loss aversion compound these issues, pushing participants to follow crowd momentum or hold losing positions too long.
Overconfidence in Detail
Traders exhibiting overconfidence often rely on recent successes to justify larger positions. This bias is amplified in crypto due to 24/7 trading and social media echo chambers. In 2026, surveys from major platforms indicated that a significant portion of retail investors believed they could time the market better than average, despite historical data showing the opposite.
Anchoring and Its Effects
Anchoring occurs when investors fixate on arbitrary reference points. For example, many held onto Ethereum positions anchored to 2024 levels during the 2026 consolidation phase, missing opportunities to reallocate based on updated network activity metrics.
Real 2026 Market Examples
During the March 2026 correction, overconfident retail traders piled into altcoins after seeing quick rebounds in prior cycles. On-chain data from Glassnode showed declining active addresses coinciding with rising exchange inflows, yet social sentiment remained bullish. Technical overlays like the Relative Strength Index (RSI) on the 4-hour chart flashed overbought conditions, highlighting the mismatch between psychology and data. Another case involved Solana traders anchoring to early-year highs amid network outages, leading to delayed exits as prices corrected further.
These examples illustrate how biases create predictable entry and exit errors. Institutional desks that incorporated bias audits avoided similar pitfalls by cross-referencing multiple data layers.
On-Chain Data Correlations and Technical Indicators
Combining behavioral insights with on-chain metrics strengthens cycle analysis. For instance, long-term holder supply metrics often diverge from anchored price expectations during euphoria phases. Overlaying these with moving average convergence divergence (MACD) helps identify when bias-driven entries occur. Correlations between funding rates on perpetual futures and social volume spikes frequently signal overconfidence peaks in 2026 data sets.
Behavioral finance principles from traditional markets apply directly here, showing how confirmation bias amplifies momentum in both bull and bear phases. Additional resources such as Federal Reserve analyses on investor psychology provide broader context for crypto-specific applications.
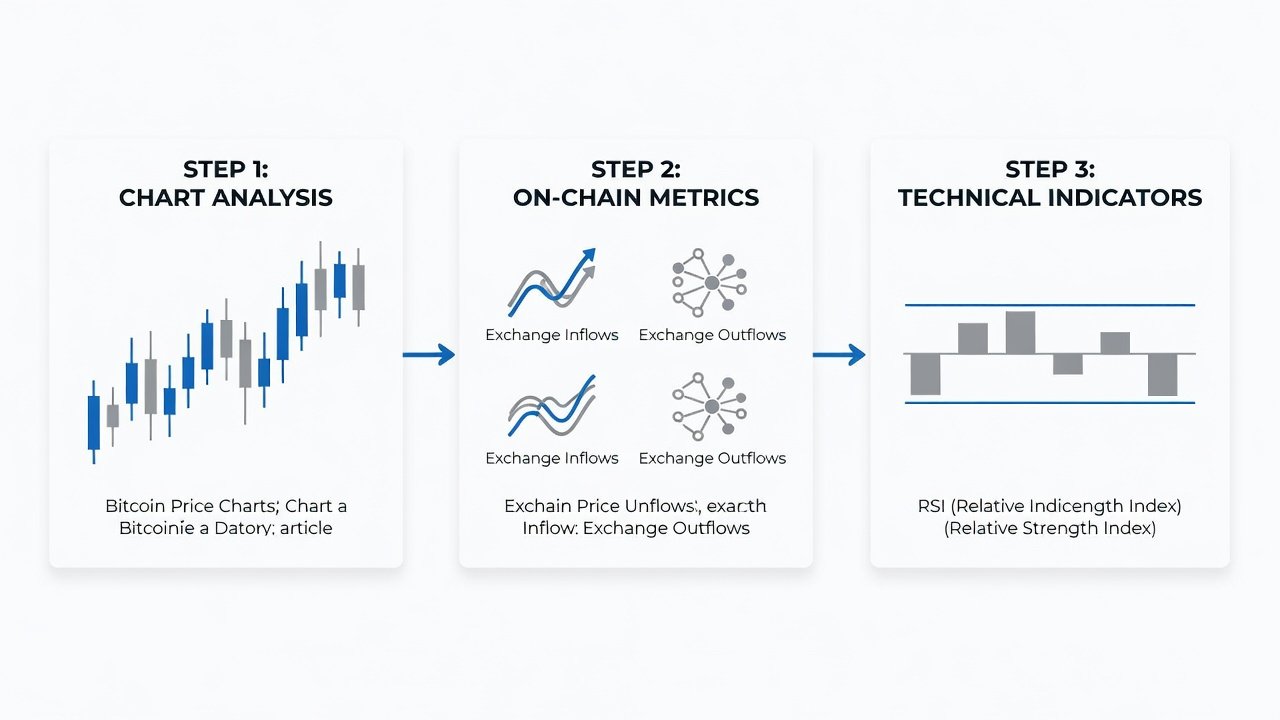
Step-by-Step Framework for Identifying Bias-Driven Entry and Exit Points
Developing a structured approach is essential. Here is an expanded framework tailored for 2026 conditions:
- Monitor social sentiment indicators alongside on-chain exchange flows to detect early signs of herding behavior.
- Identify anchoring points by reviewing historical price clusters on weekly and monthly charts, adjusting for inflation-adjusted valuations where applicable.
- Apply technical filters such as Bollinger Band squeezes and volume profile analysis to confirm or refute bias signals.
- Document personal conviction levels before executing trades to counter overconfidence, using a simple scoring system from 1 to 10.
- Review post-trade outcomes weekly against predefined benchmarks, incorporating feedback loops for continuous improvement.
- Cross-reference with macroeconomic indicators like interest rate expectations to contextualize cycle phases.
Comparisons to Traditional Finance Behaviors
Traditional equity investors during the 2025 rate-cut cycle displayed similar anchoring to pre-pandemic valuations. In crypto, the speed of information flow amplifies these effects, making biases more pronounced. Institutional players using algorithmic overlays tend to mitigate overconfidence better than retail participants. Bank for International Settlements reports highlight parallel patterns in forex markets, underscoring universal psychological challenges across asset classes.
Practical Tools and Checklists
Trader Checklist
- Review on-chain holder distribution before committing capital.
- Set alerts for technical indicator divergences from anchored price levels.
- Journal emotional state during market extremes to build self-awareness.
- Compare current cycle phase against historical analogs without assuming repetition.
- Utilize portfolio stress-testing tools to simulate bias-influenced scenarios.
Recommended Tools
Tools like on-chain dashboards from reputable providers and RSI/MACD scanners help operationalize these steps. Integrating API feeds from multiple exchanges allows for real-time bias detection layers.
Impact on Retail versus Institutional Traders
Retail traders often fall victim to emotional decision-making due to limited resources for advanced analytics. Institutional entities, however, deploy dedicated risk teams that enforce bias checks, leading to more consistent performance across cycles. In 2026, this divide became evident in performance differentials between the two groups.
FAQs
How do biases affect crypto cycle timing specifically?
They cause premature entries during perceived bottoms and delayed exits at tops, often confirmed by mismatched on-chain and technical signals.
What on-chain metrics best reveal bias?
Exchange net flows, active address trends, and realized price distributions frequently contradict anchored expectations.
Can institutions avoid these pitfalls?
Yes, through structured decision frameworks and quantitative overlays that reduce emotional anchoring.
Are there emerging biases unique to 2026?
AI-driven trading tools introduce new overreliance biases, where users trust algorithms without sufficient oversight.
Conclusion
Mastering behavioral biases remains essential for navigating 2026 crypto cycles. By integrating on-chain data, technical analysis, and self-awareness frameworks, traders can achieve superior timing and risk management. Continuous application of these insights transforms reactive decisions into disciplined strategies that withstand market turbulence.


No comments yet. Be the first!