 CryptoChain Blog
Introduction to Daily Crypto Analysis Tools
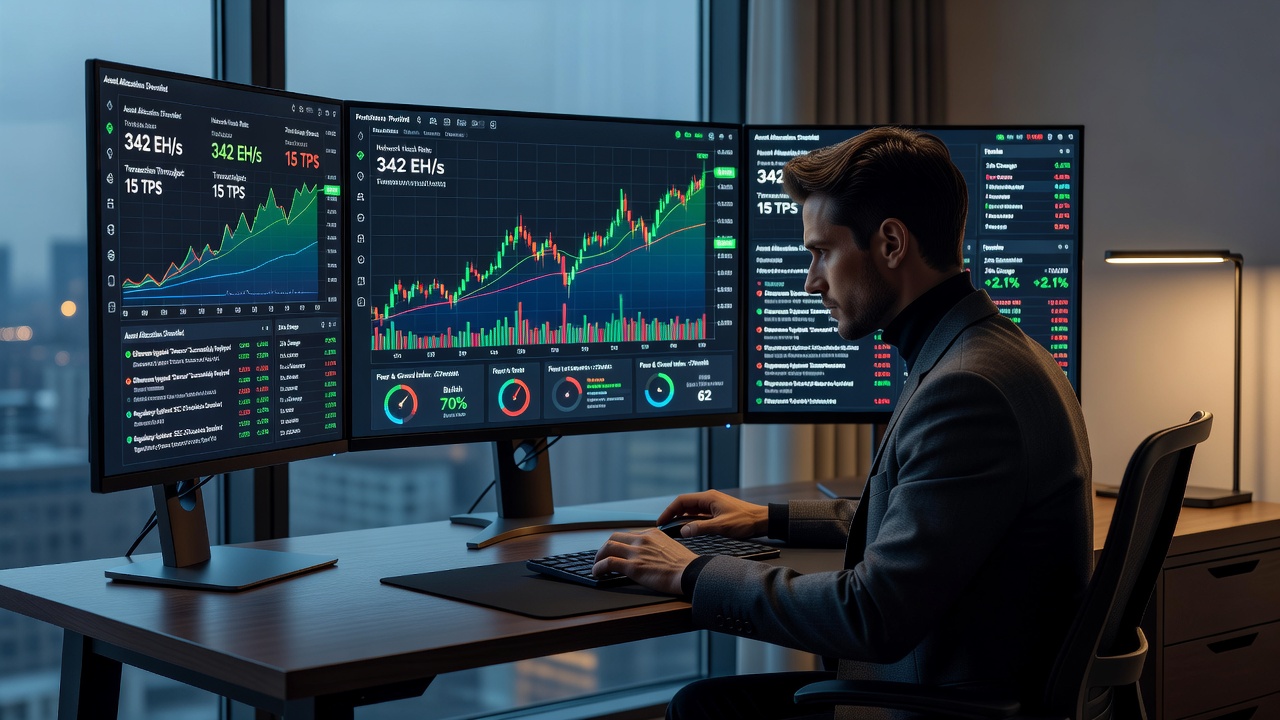
Staying ahead in cryptocurrency markets requires reliable tools that deliver real-time data, trend signals, and actionable insights. In 2026, beginner and intermediate traders rely on a focused set of platforms to monitor price action, on-chain activity, market sentiment, news flow, and portfolio performance. This guide examines five essential tools that cover every core aspect of daily crypto insights and trend analysis, helping users build consistent habits for spotting opportunities and managing risk effectively.
Whether you are just starting or looking to refine an existing process, understanding how each tool functions in real market conditions is crucial. These platforms evolve rapidly, so focusing on their core strengths allows traders to adapt without becoming overwhelmed by too many options. By the end of this article, you will have concrete steps to integrate them into your routine and examples of how they reveal trends before they become obvious to the broader market.
1. Charting Platforms for Technical Analysis
TradingView remains the leading charting platform for visualizing price movements across Bitcoin, Ethereum, and altcoins. Users start by creating a free account and adding watchlists for major pairs such as BTC/USDT and ETH/BTC. Real-world usage includes drawing trend lines and applying indicators such as moving averages, RSI, and MACD to identify potential reversals during volatile sessions. For example, a trader might notice a bullish crossover on the daily chart of Solana combined with increasing volume, signaling a possible breakout. Free plans support basic charts and community ideas, while paid tiers unlock advanced alerts, multiple chart layouts, and custom Pine Script indicators. Traders often compare the free version against premium subscriptions by testing alert frequency and script access on a demo setup before committing long term. Visit TradingView to explore their latest charting features.
Step-by-Step Setup for Beginners
First, sign up using an email or social login. Next, search for your preferred assets and create a multi-chart layout showing four timeframes simultaneously. Add drawing tools to mark support and resistance levels. Finally, set price alerts that trigger via email or mobile push when key levels are breached. This setup takes under fifteen minutes and immediately improves your ability to react to intraday movements.
2. On-Chain Dashboards for Blockchain Metrics
Glassnode provides detailed on-chain metrics including active addresses, exchange flows, and realized price data. Setup involves linking a wallet address or selecting pre-built dashboards for networks like Bitcoin and Solana. A practical example is spotting accumulation phases when large holders move coins off exchanges, often preceding upward price trends. In one 2026 scenario, a surge in non-exchange addresses for a mid-cap token coincided with positive funding rates, giving early signals of institutional interest. Free tiers offer limited daily queries, whereas paid plans deliver deeper historical data and custom API access. Comparing options helps traders decide whether basic metrics suffice or if advanced cohort analysis justifies the upgrade. Explore Glassnode dashboards for current on-chain visualizations.
Interpreting Key Metrics in Context
Focus first on exchange inflow and outflow ratios. High outflows typically indicate reduced selling pressure. Combine this with active address growth to confirm genuine network usage rather than speculative spikes. Avoid relying on single metrics; cross-reference with price action from your charting tool to build higher-confidence signals.
3. Sentiment Trackers for Market Psychology
LunarCrush aggregates social media and community data to produce sentiment scores and trend alerts. Beginners create an account, connect X (formerly Twitter) and Discord feeds, and monitor altcoin-specific gauges. Daily usage might involve checking when social volume spikes coincide with price breakouts, helping confirm momentum. During a recent altcoin rally, LunarCrush highlighted rising mentions of a particular Layer-2 project days before its price surged, allowing users to prepare entries. Free access covers core scores, while paid plans add historical sentiment backtesting and influencer tracking. Traders evaluate both tiers by reviewing how accurately each predicts short-term moves. Check LunarCrush sentiment tools.
4. News Aggregators for Timely Information
CryptoPanic compiles headlines from hundreds of sources into a customizable feed. Setup takes minutes: select preferred coins, set keyword filters, and enable push notifications. A common workflow is scanning the feed each morning for regulatory updates or partnership announcements that could shift market direction. One effective practice is filtering out low-quality sources and focusing on verified outlets to reduce noise. The platform operates entirely free, though users can upgrade for ad-free browsing and priority news alerts. Comparing the free experience against paid removes distractions during fast-moving news cycles. Browse CryptoPanic feeds.
5. Portfolio Monitors for Performance Tracking
CoinStats or similar apps allow users to import exchange API keys and track holdings across wallets in one dashboard. Daily routines include reviewing allocation percentages and unrealized gains before market open. You can also set rebalancing alerts when any asset exceeds a target percentage of your total portfolio. Free versions handle basic tracking, while paid plans add tax reporting and advanced analytics. Comparing these tiers reveals whether simple balance views meet needs or if detailed performance attribution adds value.
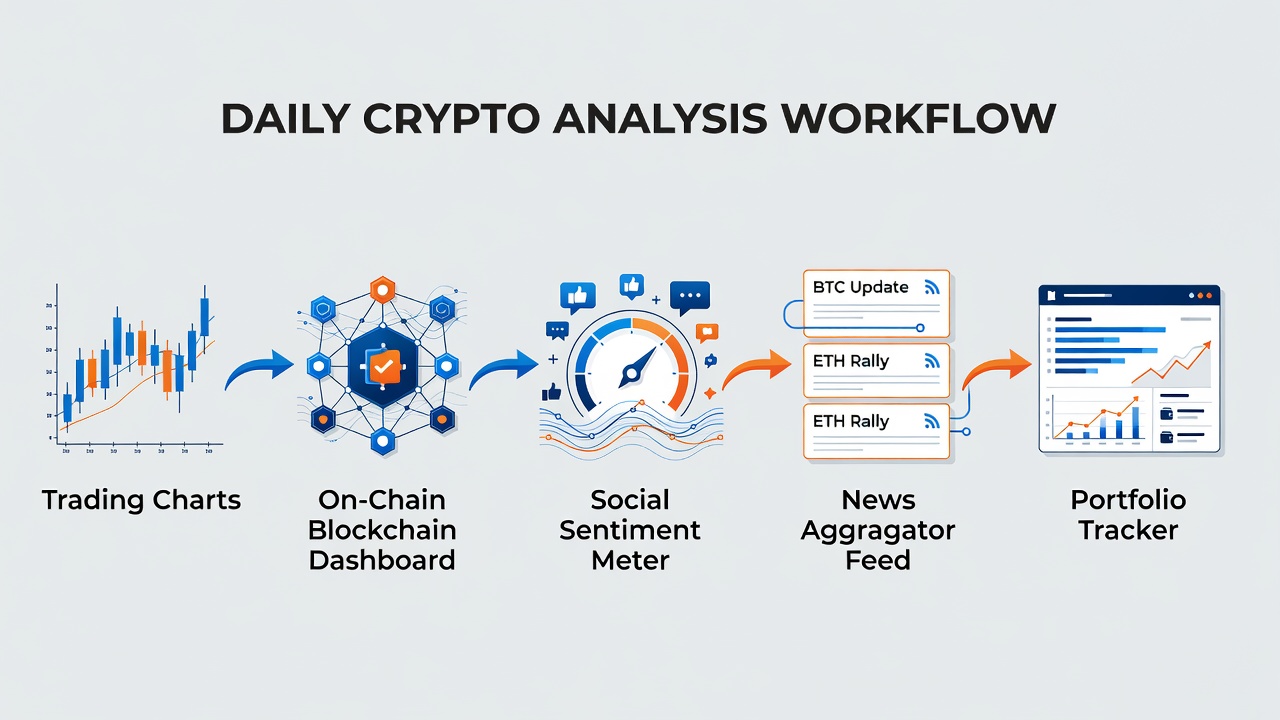
Integrating Tools Into a Daily Routine
Successful traders combine these platforms into a repeatable morning and evening workflow. Begin with TradingView to review overnight price action, then check Glassnode for on-chain confirmation, LunarCrush for sentiment shifts, CryptoPanic for breaking news, and finally CoinStats for portfolio impact. Setting phone alerts from each tool prevents information overload while ensuring no major movement is missed. Over time, this routine builds pattern recognition that improves decision speed and reduces emotional trading.
Common Mistakes to Avoid
- Over-relying on a single tool without cross-verification.
- Ignoring the difference between free and paid data depth when scaling up analysis.
- Failing to update watchlists and filters as new tokens emerge in 2026.
- Neglecting mobile notifications, which can cause missed opportunities during off-hours.
FAQ: Common Pitfalls and Best Practices
- How do I avoid information overload? Start with one primary metric per tool and expand gradually as comfort grows.
- Are free versions enough for beginners? Yes, most free tiers provide sufficient data to learn core concepts before upgrading.
- Can these tools predict price movements accurately? They offer probabilities, not certainties; always combine signals with personal risk management rules.
- What if a tool changes its pricing model? Review the latest feature list monthly to ensure continued value for your workflow.
- How should I handle conflicting signals across platforms? Prioritize on-chain and volume data over pure sentiment when discrepancies appear.
Mastering these five tools creates a solid foundation for consistent crypto insights and trend analysis throughout 2026 and beyond. Regular practice with the outlined steps will turn scattered data into clear, actionable intelligence.


No comments yet. Be the first!