 CryptoChain Blog

Introduction to Building a Custom Crypto Analysis Toolkit
In the fast-evolving cryptocurrency landscape of 2026, having a tailored analysis system can provide traders and investors with a significant edge. Market dynamics shift rapidly due to regulatory changes, technological advancements in blockchain protocols, and global economic factors, making generic tools insufficient for serious participants. This guide walks you through constructing a personalized toolkit that integrates real-time data sources, focuses on essential metrics, and automates trend detection. Whether you are a day trader seeking short-term signals or a long-term holder monitoring portfolio health, customization ensures the system aligns with your unique strategy and risk tolerance.
Starting with foundational elements like API integration and metric selection sets the stage for more advanced features such as sentiment analysis and alert systems. By the end of this process, you will have a robust setup ready for 2026 market conditions, empowering data-driven decisions rather than relying on hype or unverified social media tips. The emphasis remains on free or accessible resources to keep barriers low while scaling sophistication over time.
Selecting Key Metrics for Effective Analysis
Core metrics form the backbone of any crypto toolkit. Focus on trading volume to gauge liquidity, holder distribution to assess decentralization, and on-chain activity like transaction counts. These indicators help identify emerging opportunities before they go mainstream. Additional metrics worth tracking include realized price for cost basis insights, exchange inflows and outflows for potential selling pressure, and active address growth as a proxy for network adoption.
- Trading volume: Tracks buy and sell pressure across exchanges and helps confirm trend strength when paired with price movements.
- Holder distribution: Reveals concentration risks among large wallets, which is critical for avoiding projects vulnerable to whale dumps.
- Network growth: Measures new addresses and active users for adoption signals that often precede price rallies.
- Realized capitalization: Provides a more accurate view of market value by accounting for coins moved at different price points.
Combining these with volatility measures allows for a balanced view. For deeper insights, incorporate metrics from reliable sources such as CoinGecko. Practical application involves setting baseline thresholds for each metric based on historical data from the previous year to flag anomalies quickly.
Integrating Free APIs for Real-Time Data
Free APIs deliver live data without subscription costs. Begin by signing up for providers offering endpoints for price feeds, volume, and blockchain statistics. Use tools like Python scripts or no-code connectors to pull data into your system. Popular free options include public endpoints from major explorers that require only an API key for higher rate limits.
Step-by-step integration starts with authentication using your generated key, followed by querying specific endpoints for chosen metrics such as daily volume or wallet balances. Store results in a local database or spreadsheet for historical comparison and trend analysis. This setup supports 2026's high-frequency trading needs by refreshing every few minutes. Test connections thoroughly to handle rate limits gracefully, perhaps by implementing simple caching mechanisms. Another layer involves pulling data from Etherscan for Ethereum-based tokens to enrich your on-chain view with transaction details and token holder counts.
No-Code Dashboard Setups for Visualization
No-code platforms simplify dashboard creation, allowing users to drag and drop widgets without programming knowledge. Connect your APIs to visualize trends through charts and heatmaps that update automatically. This democratizes access to professional-grade analysis previously reserved for coders.
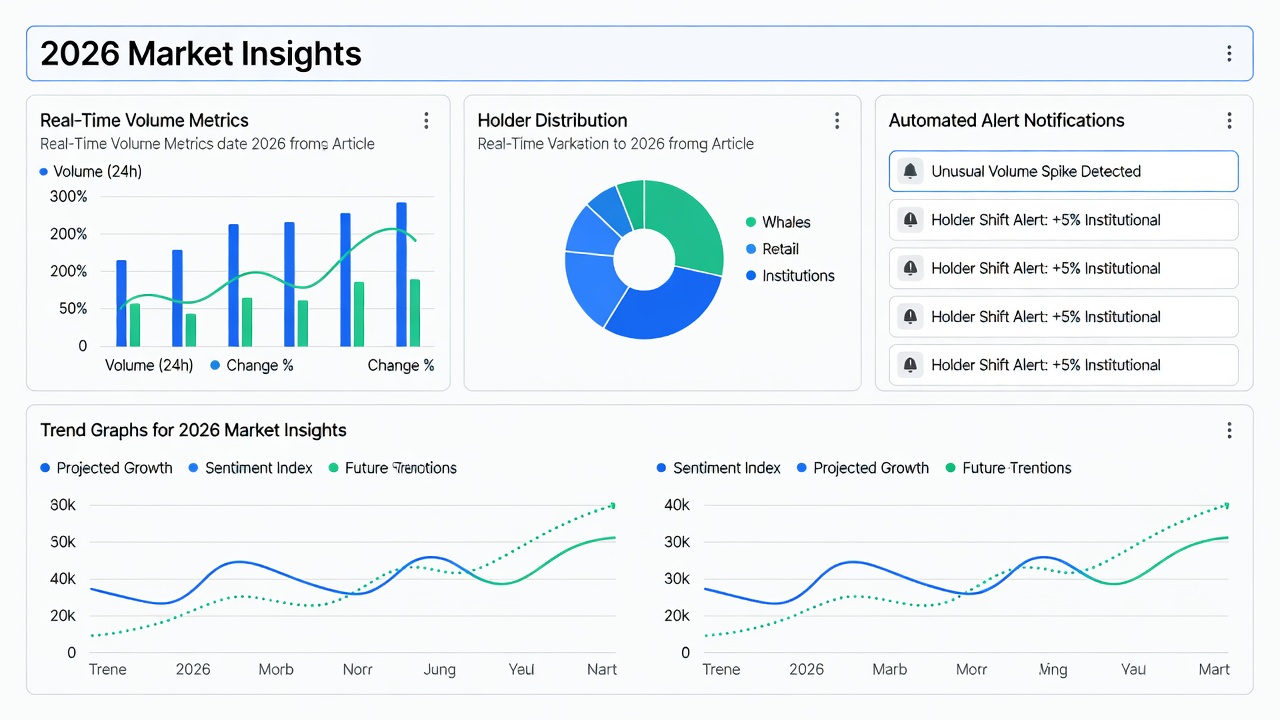
Popular options include connecting data sources to tools that support real-time updates and conditional formatting. Customize views for mobile access and add filters for specific coins or time ranges. This approach makes complex data accessible and actionable, turning raw numbers into intuitive visuals like trend lines overlaid with volume bars. Experiment with color-coded alerts directly on the dashboard to highlight when metrics cross your predefined thresholds.
Automating Alerts for Emerging Trends
Alerts keep you ahead by notifying on threshold breaches, such as sudden volume spikes or unusual holder concentration changes. Set rules based on your metrics using webhook integrations or built-in notification features in dashboard tools. Common channels include email, mobile push notifications, or even integration with messaging apps for immediate awareness.
Examples include email or app pushes for holder shifts in promising altcoins or volume surges exceeding 200 percent within an hour. Test alerts in a sandbox environment before going live to avoid false positives during volatile periods. Over time, refine rules by analyzing which alerts led to profitable trades versus noise, creating a feedback loop that improves precision.
Combining On-Chain Signals with Sentiment Sources
Enhance accuracy by merging on-chain data with social sentiment. Pull blockchain metrics alongside Twitter or news feeds for a holistic picture. This hybrid method flags discrepancies, like high volume without positive sentiment, which may indicate manipulation risks or fading momentum. Tools for sentiment can include free aggregators that score social mentions or news headlines.
Practical implementation involves API calls to both on-chain explorers and sentiment aggregators, then correlating results in your dashboard. For instance, a spike in active addresses paired with rising positive mentions could signal a breakout worth monitoring closely. This combination reduces reliance on any single data type and builds resilience against 2026-specific challenges like regulatory announcements affecting sentiment rapidly.
Practical Examples Using Current Tools
Consider a Bitcoin analysis workflow: Integrate volume APIs, set holder alerts, and visualize in a dashboard for daily review. For altcoins, layer in DeFi metrics from sources like DeFiLlama to track liquidity pools and total value locked changes. Another detailed example involves building a weekly automated report that summarizes top movers based on your custom criteria, including on-chain growth and sentiment scores. Iterate based on backtesting results from past 2025 data to validate your rules before applying them live.
Customizing for Individual Trading Styles
Day traders might prioritize high-frequency volume and volatility metrics with minute-level alerts, while swing traders focus on holder distribution trends over days or weeks. Long-term investors could emphasize network growth and realized price metrics for fundamental health checks. Tailor your toolkit by selecting only the most relevant widgets and alerts, then periodically review performance to adjust as market conditions evolve in 2026.
Common Pitfalls and How to Avoid Them
One frequent mistake is overcomplicating the initial setup with too many metrics, leading to analysis paralysis. Start with three to five core indicators and expand gradually. Another issue involves ignoring data latency during high-volatility events; mitigate this by using multiple API sources for redundancy. Finally, failing to document your custom rules makes future troubleshooting difficult, so maintain a simple log of thresholds and alert logic.
Comparing Tool Options for Your Toolkit
Evaluate platforms by ease of use, API support, and customization depth. No-code solutions suit beginners seeking quick results, while API-heavy setups offer more flexibility for advanced users comfortable with scripting. Compare based on integration speed, community support, and mobile compatibility to match your trading style and available time.
FAQ: Common Setup Issues and 2026 Challenges
How do I handle API rate limits? Use caching and batch queries to stay within free tiers while monitoring usage dashboards provided by the services.
What about data accuracy in 2026? Cross-verify multiple sources to mitigate discrepancies from new protocol updates or chain reorganizations.
Can I scale this for multiple portfolios? Yes, by modularizing your dashboard into separate views or tabs for different asset classes.
How do regulatory changes impact alerts? Build in manual override options and stay informed via official channels to pause or adjust rules during major announcements.
What if free APIs change their offerings? Maintain a list of backup providers and test migrations quarterly to ensure continuity.
Conclusion
Building your crypto analysis toolkit empowers informed decisions in 2026. Start small, test thoroughly, and refine continuously to stay competitive in dynamic markets. With consistent use, this personalized system becomes an invaluable asset for navigating volatility and identifying opportunities.


No comments yet. Be the first!