 CryptoChain Blog
Crypto Market Cycle Analysis: 2026 Insights and Strategies
Cryptocurrency markets operate in repeating yet evolving cycles that provide valuable opportunities for informed investors. Understanding these cycles in 2026 requires blending historical patterns with contemporary data sources. This comprehensive guide explores the four primary phases in depth, details methods for identifying accumulation and distribution zones, and integrates technical indicators with on-chain metrics to forecast trends. Readers will also find case studies from prior cycles, comparisons of bull and bear dynamics, recommended tools, risk considerations including regulatory developments, and proven investor strategies tailored to the current environment.
The Four Primary Phases of Crypto Cycles
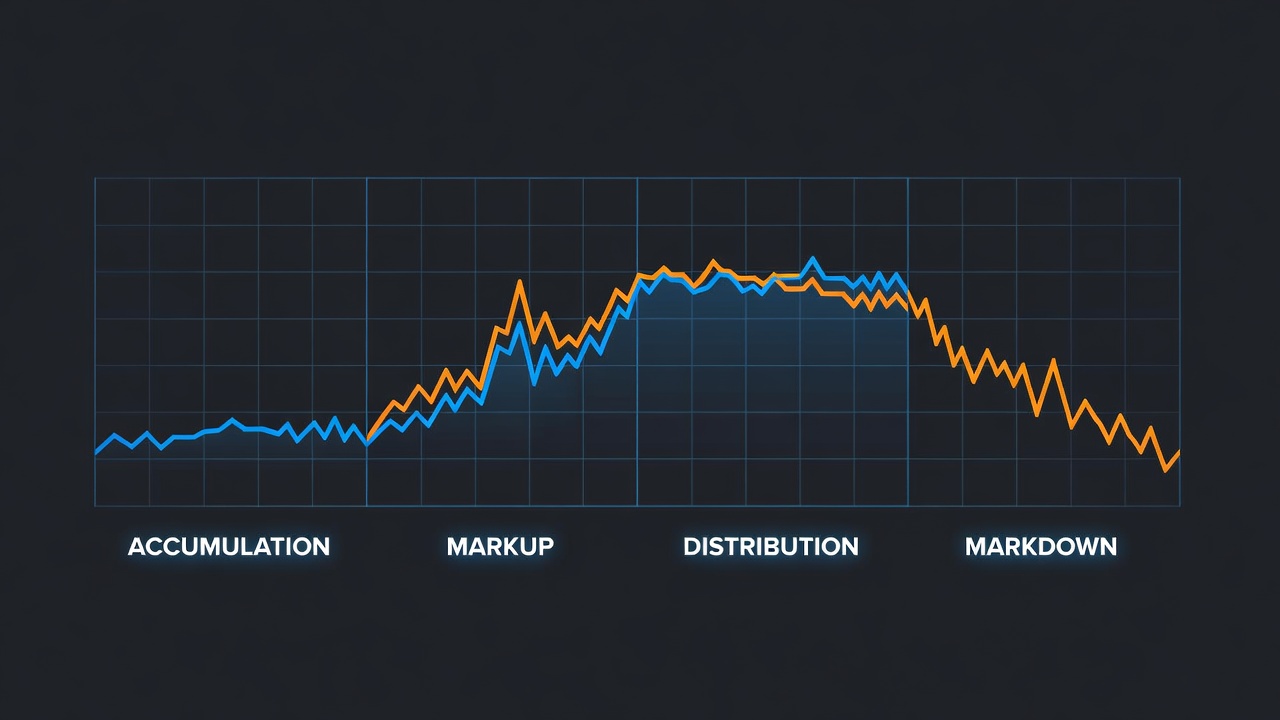
Every crypto market cycle consists of four distinct phases: accumulation, markup, distribution, and markdown. Accumulation represents the quiet period when sophisticated investors and institutions gradually build positions following a market bottom. Prices often trade sideways with low volatility as selling pressure diminishes. Markup follows when broader participation increases, driving prices higher through sustained rallies and media attention. Distribution occurs as early holders begin selling into strength, creating resistance levels while retail enthusiasm peaks. Finally, markdown brings sharp declines, forced liquidations, and widespread capitulation that resets the market for the next accumulation phase.
In 2026, factors such as maturing institutional infrastructure and evolving global regulations may compress or extend these phases compared to earlier cycles. For instance, clearer frameworks could prolong markup periods by encouraging sustained capital inflows.
Identifying Accumulation and Distribution Periods
Spotting these zones demands a systematic approach. Begin by analyzing exchange reserve trends; consistent outflows often indicate accumulation as coins move to private wallets. Next, examine realized price metrics to determine the average cost basis of long-term holders. When current prices hover near or below this level during sideways trading, accumulation signals strengthen. Funding rates on derivatives platforms provide additional confirmation—persistently negative rates amid range-bound prices frequently precede major bottoms.
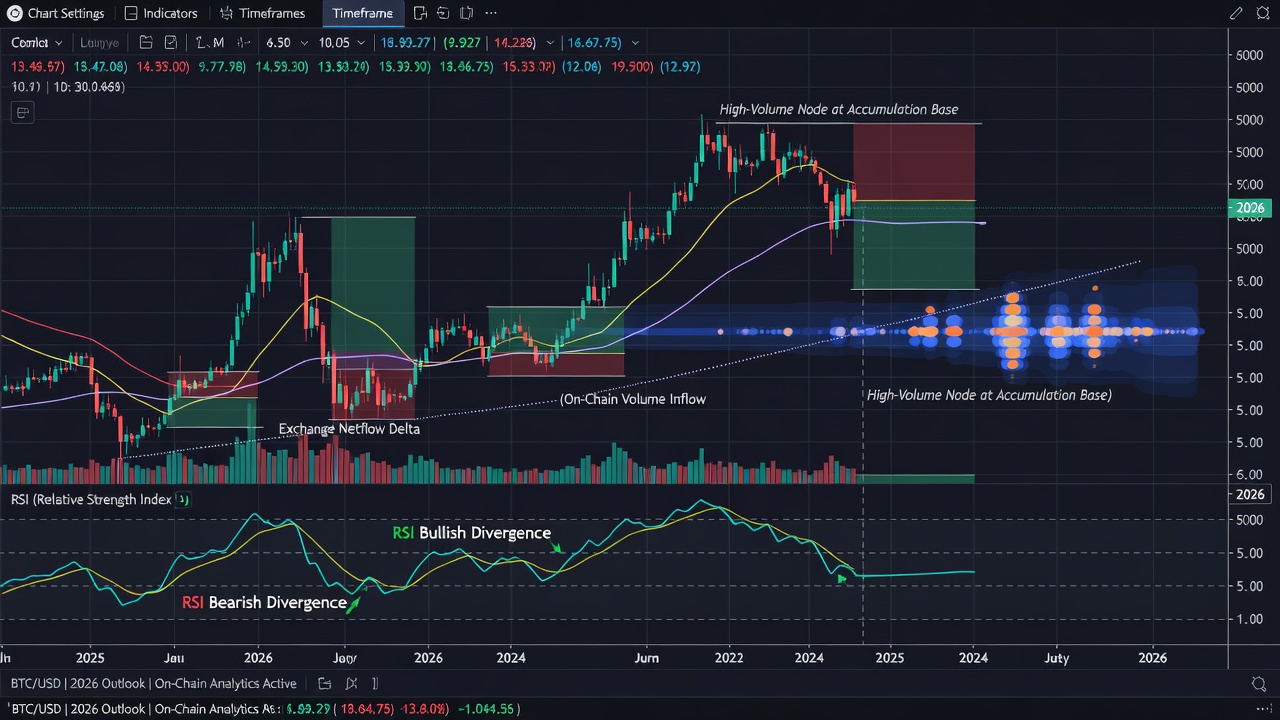
Distribution reveals itself through rising exchange inflows, elevated positive funding rates near local highs, and declining active addresses despite price appreciation. Combine these observations with technical tools such as RSI divergence on daily charts and volume profile analysis at key resistance zones. Historical examples from 2021 show distribution clusters forming when multiple signals aligned over several weeks.
Technical Indicators for 2026 Cycle Timing
A multi-timeframe strategy enhances accuracy. The 200-week moving average has served as reliable dynamic support during previous bear markets and remains relevant for 2026 analysis. Daily RSI readings above 70 often warn of local distribution, while sub-30 levels during consolidation frequently mark capitulation points. Moving average convergence divergence (MACD) crossovers on weekly charts can further validate phase transitions.
Traders should also monitor Bollinger Band width for volatility contractions that precede breakouts. In 2026, overlaying these indicators with macroeconomic data such as central bank policy shifts provides context for cycle amplitude.
On-Chain Metrics and Their Role in 2026 Analysis
On-chain data offers objective insights unavailable in traditional markets. The MVRV Z-score compares market value to realized value, highlighting periods of overvaluation or undervaluation. The Puell Multiple assesses miner revenue relative to historical averages, often bottoming during accumulation. Active address counts and transaction volume trends reveal genuine network usage versus speculative activity.
Investors can access these metrics through platforms that aggregate blockchain data. When multiple on-chain indicators reach extreme lows simultaneously, forward returns have historically been strong over the subsequent year. Combining these with technical signals creates a robust framework for 2026 decision-making.
Case Studies: Applying Past Cycles to 2026 Data
The 2017–2018 cycle featured Bitcoin advancing more than twentyfold during markup before an 85 percent markdown. The 2020–2022 cycle compressed similar movements into a shorter timeframe with a sixfold advance followed by a 75 percent decline. Current 2026 data shows realized capitalization growth rates and institutional adoption levels that analysts compare against these benchmarks to estimate phase duration and intensity. For example, slower reserve depletion rates in early 2026 may indicate a prolonged accumulation phase relative to 2020 patterns.
Bull Market vs Bear Market Dynamics
Bull markets exhibit rising open interest, increasing leverage ratios, and narrative-driven rallies across altcoins. Retail participation surges and media coverage intensifies. Bear markets, by contrast, feature deleveraging cascades, falling network activity metrics, and capital consolidation into established assets such as Bitcoin and Ethereum.
- Bull phases reward momentum strategies and selective altcoin exposure after confirmation signals appear.
- Bear phases favor defensive positioning, cash preservation, and gradual accumulation of core holdings.
- 2026 dynamics may diverge due to expanded derivatives markets and regulatory oversight from the U.S. Securities and Exchange Commission and the Commodity Futures Trading Commission.
Practical Tools and Risk Factors
Essential resources include Glassnode for on-chain analytics, TradingView for charting, and Dune Analytics for custom queries. Risk factors encompass sudden regulatory announcements that can accelerate distribution, macroeconomic liquidity shifts tracked via central bank balance sheets, and black-swan events such as major exchange failures. Monitoring policy updates from institutions like the International Monetary Fund helps anticipate external pressures on cycle progression.
Actionable Investor Strategies
- Establish core positions in Bitcoin and Ethereum during confirmed accumulation through disciplined dollar-cost averaging.
- Deploy satellite allocations to higher-risk assets only after markup confirmation via rising volume and positive funding rates.
- Define exit rules using MVRV Z-score thresholds instead of absolute price targets to remove emotional bias.
- Reserve 10 to 20 percent of portfolio capital for opportunistic purchases during markdown phases.
- Regularly rebalance based on on-chain and technical confluence rather than fixed calendars.
Common Analysis Pitfalls to Avoid
Many investors over-rely on single indicators or anchor expectations to previous cycle price levels instead of relative metrics. Ignoring macroeconomic liquidity conditions or dismissing regulatory developments often leads to mistimed entries and exits. Maintaining a disciplined, multi-signal approach mitigates these risks.
Conclusion
Successful navigation of 2026 crypto cycles depends on integrating phase recognition, technical analysis, and on-chain intelligence with prudent risk management. By applying the frameworks outlined above, investors can improve timing and position sizing while avoiding common traps that erode returns.
FAQ
When is the best time to enter a new position in 2026?
Optimal entries align with simultaneous low MVRV Z-score readings, declining exchange reserves, and negative perpetual funding rates. These conditions have historically clustered near cycle lows across multiple market eras.
What are the most common analysis pitfalls?
Over-reliance on isolated indicators, neglecting macro liquidity trends, and anchoring to prior cycle highs instead of realized price metrics frequently undermine performance. Diversifying signal sources reduces these errors.
How do regulatory changes affect cycle timing?
Clear regulatory frameworks can extend bull phases by attracting institutional participation, whereas abrupt enforcement actions often compress distribution and accelerate markdown periods.
Should investors adjust strategies mid-cycle?
Yes, when on-chain and technical confluence shifts materially. Predefined rules based on multiple metrics allow for systematic adjustments without emotional interference.

No comments yet. Be the first!