 CryptoChain Blog
Introduction to On-Chain Analytics in DeFi 2026
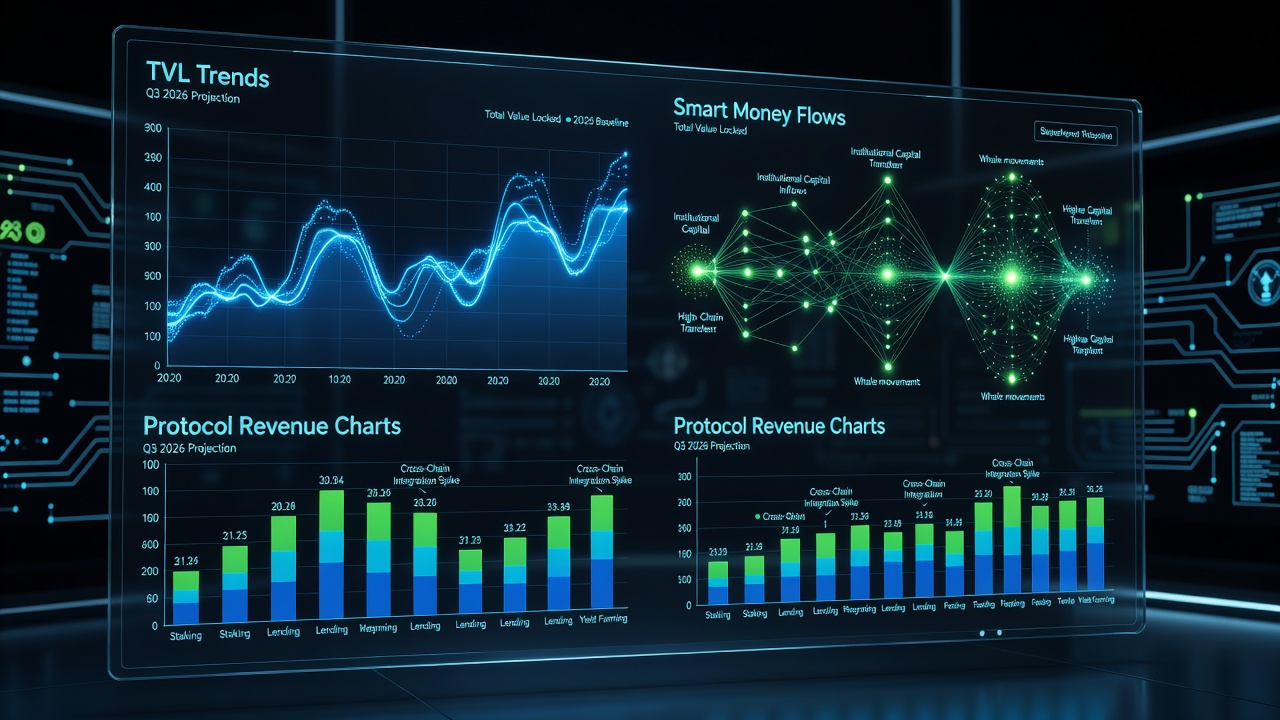
Advanced DeFi participants in 2026 increasingly rely on on-chain data to move beyond basic yield farming. This approach delivers precise insights into liquidity, capital movements, and protocol health. By tracking metrics such as total value locked trends, smart money flows, protocol revenue, and wallet clustering, users can time entries and exits more effectively while avoiding common traps. On-chain analytics has evolved from simple dashboard watching into a sophisticated discipline that combines quantitative analysis with behavioral insights from blockchain activity. Investors who master these techniques gain a measurable edge in volatile markets where public narratives often lag behind actual capital flows.
Effective analysis requires familiarity with platforms like Dune Analytics and Arkham Intelligence. These tools transform raw blockchain data into actionable intelligence. In addition, cross-referencing with DefiLlama provides standardized TVL benchmarks across chains. The result is a multi-layered view that helps distinguish genuine growth from temporary hype.
Core Metrics That Drive Decision-Making
TVL Trends and Their Implications
Total value locked remains a foundational indicator. Sustained TVL growth often signals strong user adoption and capital inflows, while sudden drops can foreshadow liquidity issues or shifts in sentiment. In 2026, analysts examine 30-day and 90-day rolling averages alongside chain-specific breakdowns to identify emerging ecosystems. For example, a protocol showing steady TVL increases on Layer-2 networks but flat activity on mainnet may indicate migration toward lower fees rather than organic expansion. Users should also segment TVL by asset type, noting when stablecoin dominance rises as a potential warning of reduced risk appetite.
Smart Money Flows
Smart money refers to wallets associated with known venture funds, market makers, or high-performing traders. Monitoring their deposits and withdrawals helps surface early signals of protocol interest or exits. Clustering techniques group these addresses to reveal coordinated activity patterns. Advanced practitioners build cohort analyses that track wallet age, historical win rates, and interaction frequency with specific contract addresses. This level of granularity reveals whether inflows represent new capital or merely recycled positions from earlier cycles.
Protocol Revenue Analysis
Revenue generated through fees, token burns, or treasury inflows provides a clearer picture of sustainability than TVL alone. Protocols with rising revenue relative to TVL often demonstrate stronger product-market fit. In 2026, analysts calculate revenue multiples by dividing annualized protocol revenue by current TVL to compare efficiency across similar projects. Consistent revenue growth accompanied by stable or declining token emissions typically indicates healthier tokenomics.
Wallet Clustering Techniques
Wallet clustering goes beyond simple labeling by identifying behavioral patterns such as repeated bridging activity or synchronized staking events. Tools that apply graph algorithms can surface previously unknown relationships between addresses, helping users anticipate large movements before they appear in price action.
Essential Tools: Dune Analytics and Arkham
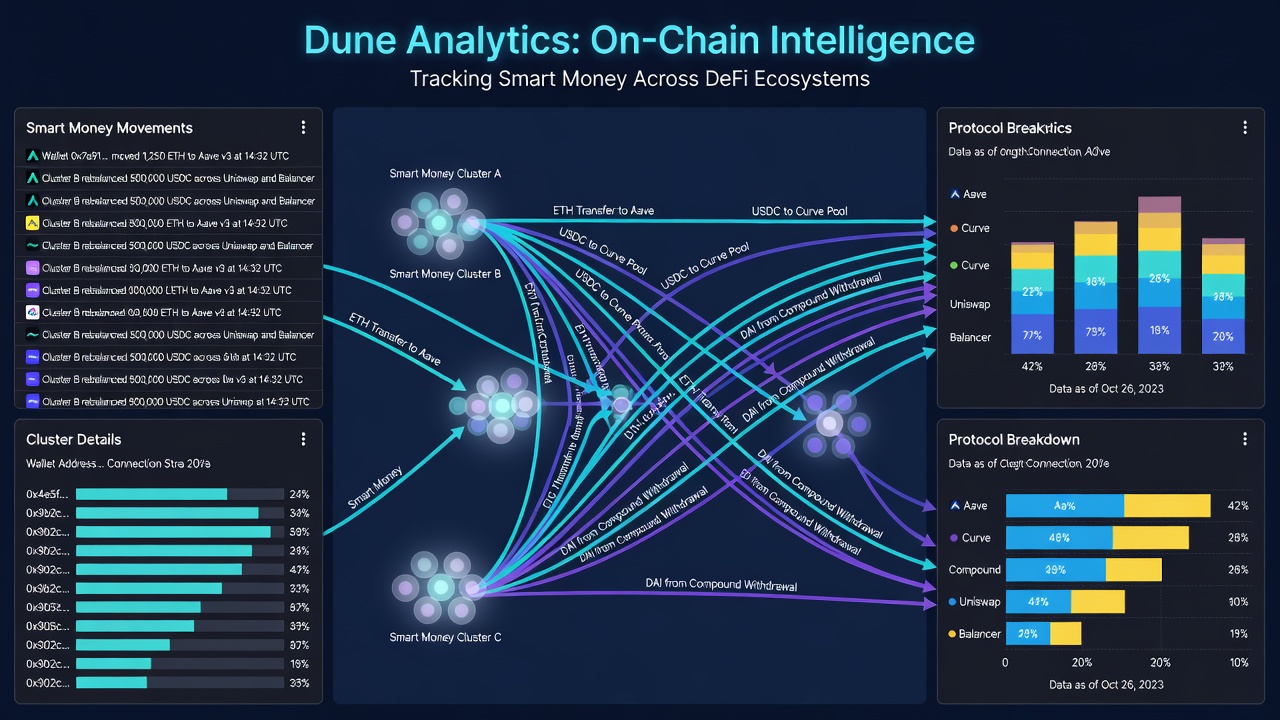
Dune Analytics enables custom SQL queries across multiple chains, while Arkham offers entity labeling and flow visualization. Combining both platforms allows users to cross-verify signals and reduce noise from single-source data. Dune excels at historical trend analysis and community-shared dashboards, whereas Arkham provides real-time alerts on labeled entities. Users often export data from one platform into the other for deeper correlation studies.
Building Custom Dashboards
Start by defining key questions, such as “Which protocols show consistent smart money accumulation?” Create queries for wallet cohorts, then layer in revenue and TVL metrics. Use parameterized dashboards to track multiple assets simultaneously. Regular backtesting against historical price action refines signal accuracy. Advanced users incorporate alerting mechanisms that trigger when clustering activity exceeds predefined thresholds or when revenue growth diverges from TVL by more than 15 percent over a seven-day window. Maintaining version-controlled query libraries ensures reproducibility and allows teams to iterate quickly when new chains or protocols emerge.
Interpreting Signals for Entry and Exit Timing
- Monitor divergence between TVL growth and revenue contraction as a potential red flag indicating unsustainable incentives.
- Track wallet clustering to detect accumulation phases before public announcements or governance proposals.
- Combine on-chain flows with broader market context to avoid false positives during high-volatility periods such as major token unlocks.
- Examine transaction velocity alongside average hold times to distinguish speculative flows from long-term positioning.
Free Versus Premium Analytics Platforms
Free tiers on Dune and DefiLlama suffice for basic monitoring and community dashboard exploration. Premium offerings from Arkham and specialized providers deliver labeled datasets, API access, advanced clustering algorithms, and priority support. Evaluate based on research depth required rather than defaulting to paid tools. Many users begin with free resources and upgrade only when their strategy demands real-time entity tracking or custom data exports at scale.
Step-by-Step Example: Spotting Alpha Opportunities
- Query Dune for protocols with 20%+ TVL growth over 14 days and filter for those with revenue growth above 10% in the same period.
- Filter results using Arkham to isolate wallets linked to known funds or previously profitable traders.
- Cross-reference revenue trends and note any divergence from TVL that might indicate incentive-driven inflation.
- Validate with on-chain transaction volume and average transaction size before allocating capital.
- Monitor the cluster for 48 hours to confirm sustained activity rather than one-off transfers.
Real-World Case Studies from 2026 Protocols
One prominent lending protocol showed smart money inflows three weeks before a major governance upgrade that introduced new collateral types. Analysts using clustered wallet data captured the subsequent yield expansion and exited positions ahead of a later correction. Another case involved a decentralized exchange where revenue spikes preceded visible TVL growth by ten days, highlighting the value of revenue-first screening when TVL data lagged due to bridge delays. These examples demonstrate how combining multiple metrics reduces reaction time to genuine opportunities.
Risk Flags and Avoiding False Positives
Watch for wash trading that inflates volume metrics without corresponding revenue. Seasonal liquidity events and bridge-related flows can distort TVL readings, especially around month-end reporting periods. Always require confirmation across at least two independent data sources before acting. Additional red flags include sudden concentration of TVL in a single wallet cohort or revenue derived primarily from a small number of large transactions that may not recur.
Frequently Asked Questions
How often should dashboards be updated?
Daily refreshes capture short-term flows, while weekly reviews suit longer-term strategy adjustments. High-frequency traders may set automated alerts for intraday movements.
Can on-chain data predict price movements reliably?
No single metric guarantees outcomes. Combine multiple signals and maintain risk management protocols including position sizing and stop-loss rules.
What are common data pitfalls?
Over-reliance on headline TVL figures, ignoring contract upgrades that reset metrics, and failing to account for bridged assets across chains are frequent mistakes.
How important is cross-chain analysis?
Extremely important in 2026 as liquidity fragments across Layer-2 solutions and alternative Layer-1 networks. Single-chain views often miss migration trends.
Should beginners start with free or paid tools?
Begin with free tiers to learn query logic and metric interpretation before investing in premium features that add speed and labeling depth.
Conclusion
Mastering on-chain analytics in 2026 empowers DeFi users to build resilient, data-driven strategies. Consistent application of TVL, revenue, and flow analysis through tools like Dune and Arkham delivers a meaningful edge when executed with discipline and continuous refinement.


No comments yet. Be the first!