 CryptoChain Blog
Introduction to Smart Money Tracking in DeFi
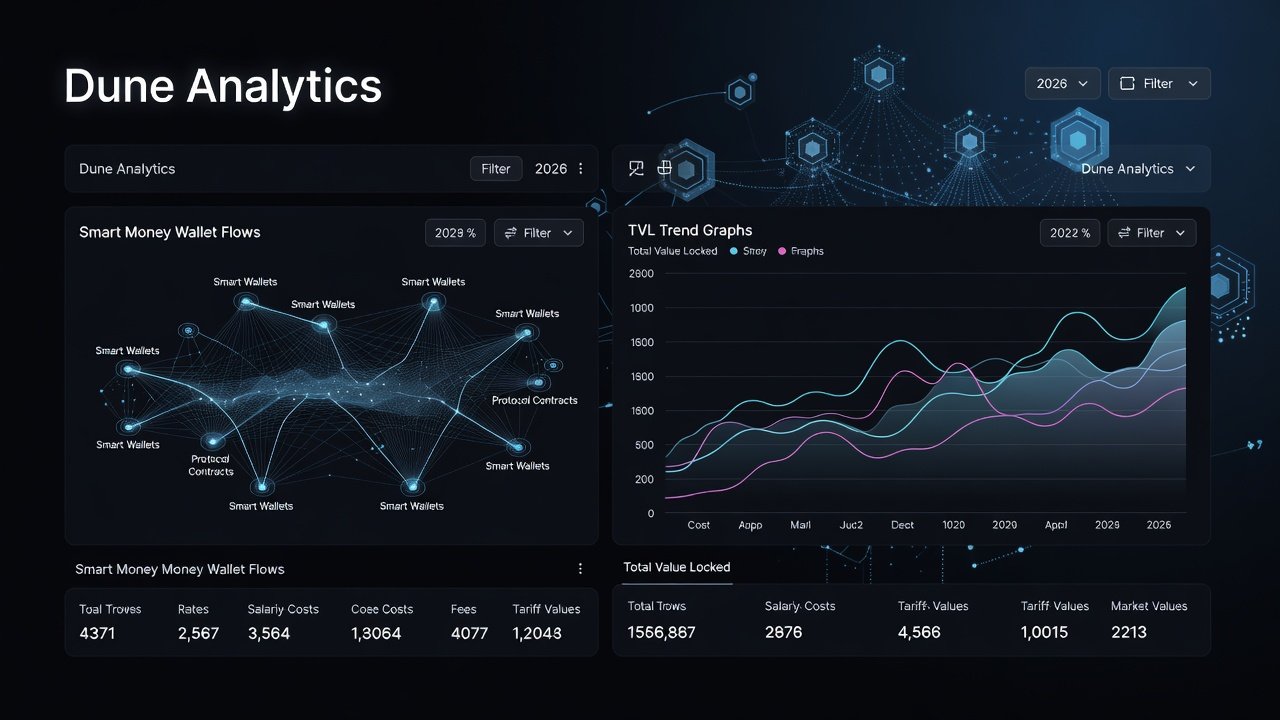
Advanced DeFi participants in 2026 rely on precise on-chain data to identify profitable opportunities ahead of the broader market. Smart money tracking involves monitoring wallets and entities that consistently generate alpha through early entries into high-potential protocols, often before public narratives form. Dune Analytics serves as the primary open platform for this analysis, enabling users to query blockchain data directly and create real-time alerts without relying solely on paid services. This approach empowers sophisticated traders to move beyond hype and base decisions on verifiable metrics such as capital inflows, revenue generation, and coordinated wallet behavior.
In today's evolving landscape, where DeFi protocols span multiple chains and liquidity fragments across ecosystems, mastering these tools provides a competitive edge. This guide covers core metrics in depth, detailed dashboard construction processes, tool comparisons, multiple case studies, risk warnings, and practical strategies to help experienced users build sustainable data-driven approaches.
Core Metrics for Smart Money Analysis
Effective tracking begins with a solid understanding of foundational indicators that reveal underlying protocol strength and smart money positioning. These metrics should be monitored in combination rather than isolation to avoid misleading conclusions.
TVL Trends and Their Implications
Total Value Locked trends serve as a primary signal of capital movement. Week-over-week or month-over-month changes can highlight protocols attracting sophisticated capital before retail follows. For instance, a steady TVL increase accompanied by rising average deposit sizes often indicates smart money accumulation rather than temporary incentive farming. Analysts should also examine TVL composition by chain and asset type to understand concentration risks.
Protocol Revenue Metrics
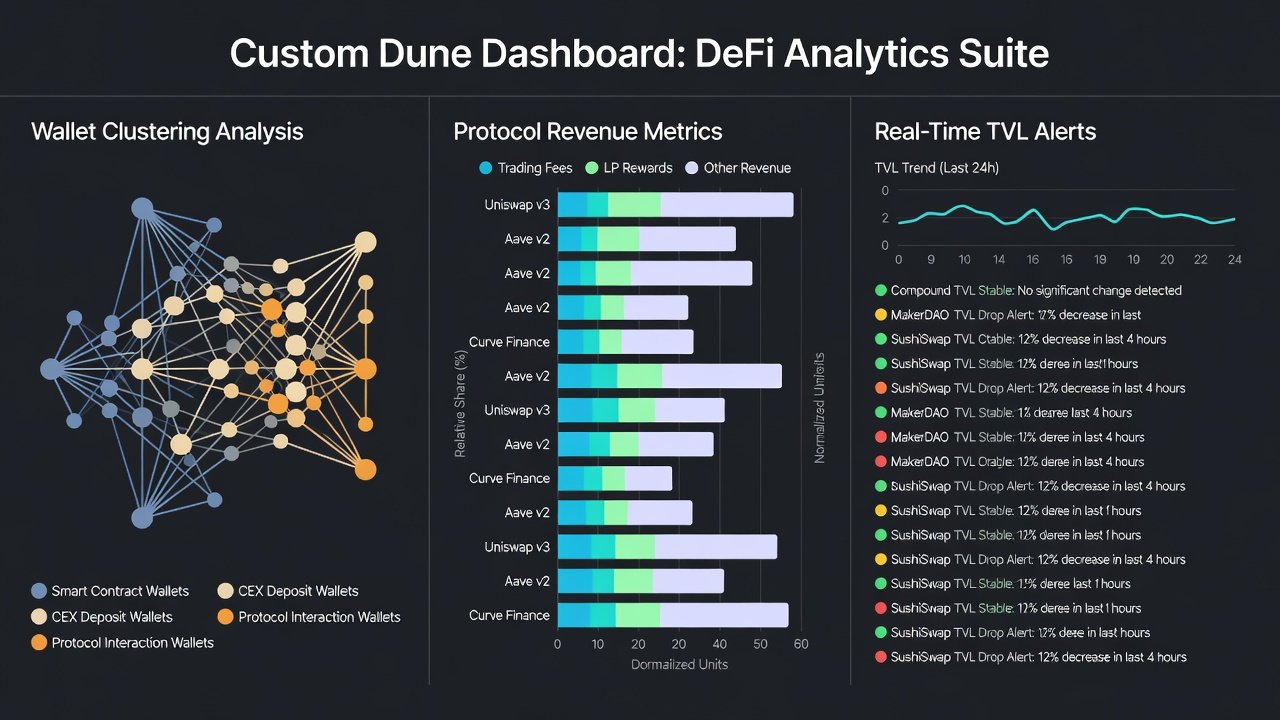
Revenue tracking provides insight into sustainable value creation. Metrics such as daily fees generated, revenue share to token holders, and treasury growth help differentiate protocols with real product-market fit from those relying on short-term liquidity mining. Smart money frequently accumulates positions in protocols showing consistent revenue growth even during broader market downturns.
Wallet Clustering Techniques
Wallet clustering groups addresses exhibiting similar behavioral patterns, such as simultaneous deposits into new protocols or correlated withdrawal timing. This reveals coordinated activity from venture funds, market makers, or high-frequency traders. Advanced users combine clustering with labels from external sources to filter noise and focus on high-conviction entities.
- Cross-protocol interactions: Track wallets moving funds between lending platforms, DEXes, and yield aggregators within short timeframes.
- Deposit size thresholds: Apply minimum thresholds to exclude small retail transactions and isolate meaningful flows.
- Time-based filters: Use rolling windows of 7 to 30 days to capture recent smart money activity while ignoring outdated positions.
Building Custom Dune Dashboards for Real-Time Alerts
Dune Analytics allows creation of personalized queries using SQL, offering unmatched flexibility for custom metrics. Users can start with public templates and progressively refine them for specific strategies.
Step 1: Connect your Ethereum or multi-chain wallet to Dune and explore existing community dashboards focused on DeFi protocols.
Step 2: Identify and label target smart money wallets using public sources or known venture fund addresses, then import them into your query parameters.
Step 3: Construct queries that filter transactions across major chains, incorporating joins for token transfers and contract interactions.
Step 4: Build visualizations including line charts for TVL movements, bar charts for revenue distribution, and heatmaps for wallet cluster activity.
Step 5: Configure automated alerts through Dune's built-in notification features or integrate outputs with external services like webhooks for immediate updates.
Step 6: Test queries on historical data to validate signal accuracy before deploying live versions.
Step 7: Iterate by adding new metrics such as governance participation rates or liquidity provision changes based on initial results.
Example query for wallet clustering: SELECT wallet_address, COUNT(DISTINCT protocol) as protocols_used, SUM(amount_usd) as total_flow FROM transactions WHERE timestamp BETWEEN current_date - INTERVAL '30 days' AND current_date GROUP BY wallet_address HAVING COUNT(DISTINCT protocol) > 3 AND SUM(amount_usd) > 50000 ORDER BY total_flow DESC;
Another practical query focuses on protocol revenue spikes: SELECT protocol_name, DATE(timestamp) as date, SUM(revenue_usd) as daily_revenue FROM protocol_revenue WHERE chain = 'ethereum' GROUP BY protocol_name, DATE(timestamp) HAVING daily_revenue > (SELECT AVG(daily_revenue) * 1.5 FROM protocol_revenue);
Comparing Nansen and Arkham Intelligence
While Dune provides raw query power and complete customization, specialized platforms add valuable layers of pre-processed intelligence. Nansen excels in comprehensive wallet labeling and portfolio tracking across its subscription tiers, making it efficient for quick scans of smart money movements. Arkham Intelligence specializes in entity mapping and visual relationship graphs that simplify cluster analysis and identification of connected addresses.
Dune remains completely free with full query control, positioning it as the foundation for users who want to define unique metrics rather than depend on vendor-defined dashboards. The optimal workflow combines all tools: Dune for bespoke alerts and deep dives, Nansen for rapid labeling of unknown wallets, and Arkham for mapping fund relationships and historical flows. This layered approach reduces blind spots and increases confidence in signals.
Case Studies of Profitable Trades
One notable 2026 example involved a cluster of wallets identified through Dune queries entering a new decentralized lending protocol three weeks prior to its TVL increasing by over 400 percent. These addresses accumulated the governance token at approximately twelve cents before revenue metrics confirmed sustainable fee generation, leading to exits near one dollar eighty. The coordinated timing across fifteen addresses provided a high-conviction signal that retail participants missed until later.
A second case centered on a DEX aggregator showing unusual clustered deposits from previously labeled smart money entities. Revenue per transaction rose sharply while TVL remained stable, indicating organic usage growth rather than mercenary liquidity. Traders who followed this pattern achieved roughly six times returns within forty-five days by entering early and exiting after governance proposals signaled further incentives.
These examples underscore the value of combining multiple data points rather than relying on any single metric in isolation.
Risks, False Signals, and Data Interpretation Challenges
Interpreting on-chain data carries inherent risks that can lead to losses if not managed carefully. Many labeled wallets belong to market makers executing neutral strategies rather than directional bets. Temporary TVL increases often stem from short-term incentive programs instead of genuine demand. Governance token unlocks or large treasury movements can distort clustering results. Users should always cross-reference at least three independent metrics and consider broader market context such as macroeconomic events or competing protocol launches.
Mistakes to Avoid When Tracking Smart Money
Common pitfalls include over-reliance on a single dashboard without periodic validation, ignoring gas fee impacts on smaller chains, and failing to account for multi-sig or exchange cold wallet activity. Another frequent error is chasing every cluster movement without confirming revenue or usage fundamentals first. Maintain a journal of past signals and their outcomes to refine future decision thresholds.
FAQ: Common Questions on Dune-Based Smart Money Tracking
How do I start with Dune queries if I have limited SQL experience? Begin with public templates and modify one parameter at a time while reviewing results visually.
What chains does Dune support best for DeFi analysis in 2026? Ethereum, Base, and Solana currently provide the richest and most frequently updated datasets for smart money flows.
How can I filter out noise when performing wallet clustering? Apply minimum transaction volume thresholds, time-based rolling windows, and exclude known exchange addresses from results.
Are there limitations to real-time alerts on Dune? Indexer speed introduces minor delays; supplement critical monitoring with direct RPC connections or additional tools for sub-minute precision.
Should I share my custom dashboards publicly? Sharing can build community feedback but consider keeping proprietary query logic private to maintain an information edge.
How often should dashboards be updated? Review and refresh queries weekly to incorporate new protocols and adjust thresholds based on evolving market conditions.
Conclusion
Mastering Dune Analytics for smart money tracking equips advanced DeFi users with repeatable, evidence-based strategies that go beyond speculation. By focusing on TVL trends, protocol revenue, precise wallet clustering, and layered tool usage, traders can identify high-probability opportunities while staying mindful of interpretation risks. Begin constructing your initial custom dashboard today to build proficiency and maintain an advantage in the dynamic 2026 DeFi environment.
No comments yet. Be the first!