 CryptoChain Blog
Introduction to Mean Reversion Pair Trading in DeFi
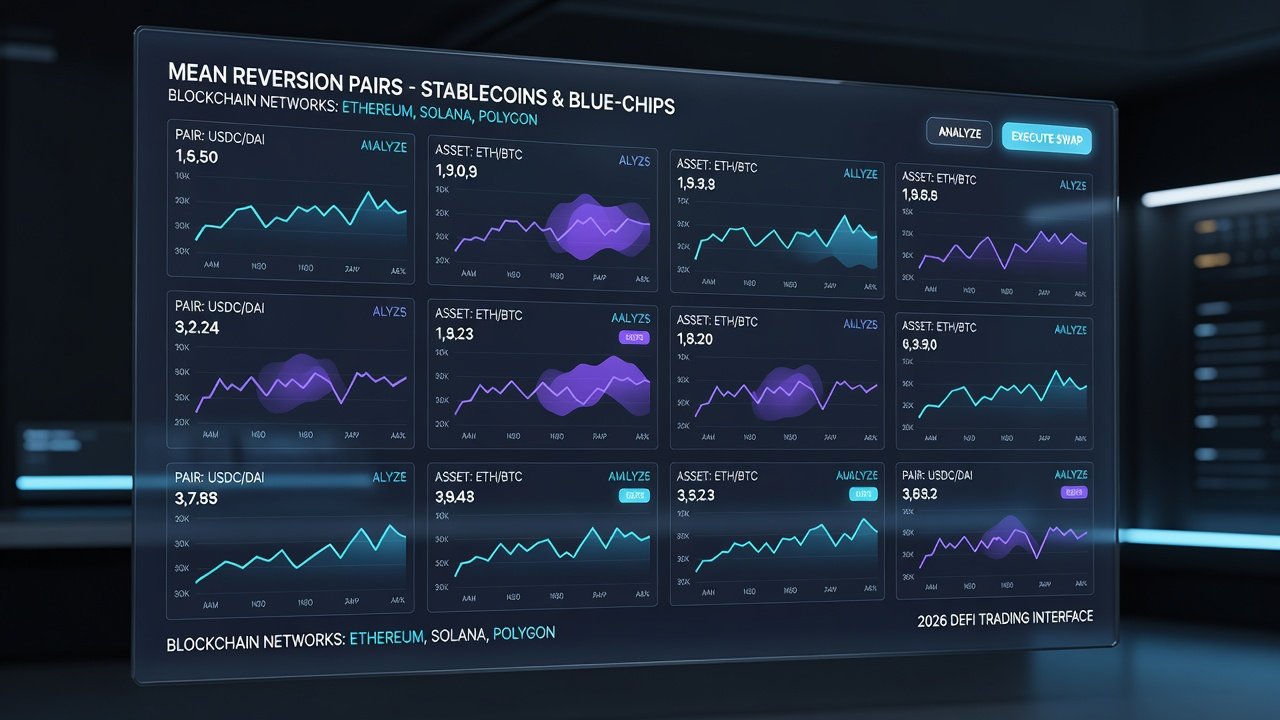
Mean reversion pair trading has emerged as a powerful statistical arbitrage strategy in decentralized finance. By identifying cointegrated asset pairs that historically move together, traders can profit from temporary deviations. In 2026, on-chain signals enhance this approach, allowing precise execution across blockchain networks. This strategy builds on traditional finance concepts but adapts them to the unique transparency and composability of DeFi protocols. Traders monitor price spreads between assets like stablecoins or blue-chip tokens, entering positions when deviations occur and exiting upon reversion to the mean. The result is a market-neutral approach that reduces directional risk while capturing inefficiencies in liquidity pools and perpetual futures markets. Success depends on robust data analysis, timely signal generation, and disciplined risk management to handle sudden correlation shifts common in crypto markets.
Cointegration Testing Methods for DeFi Pairs
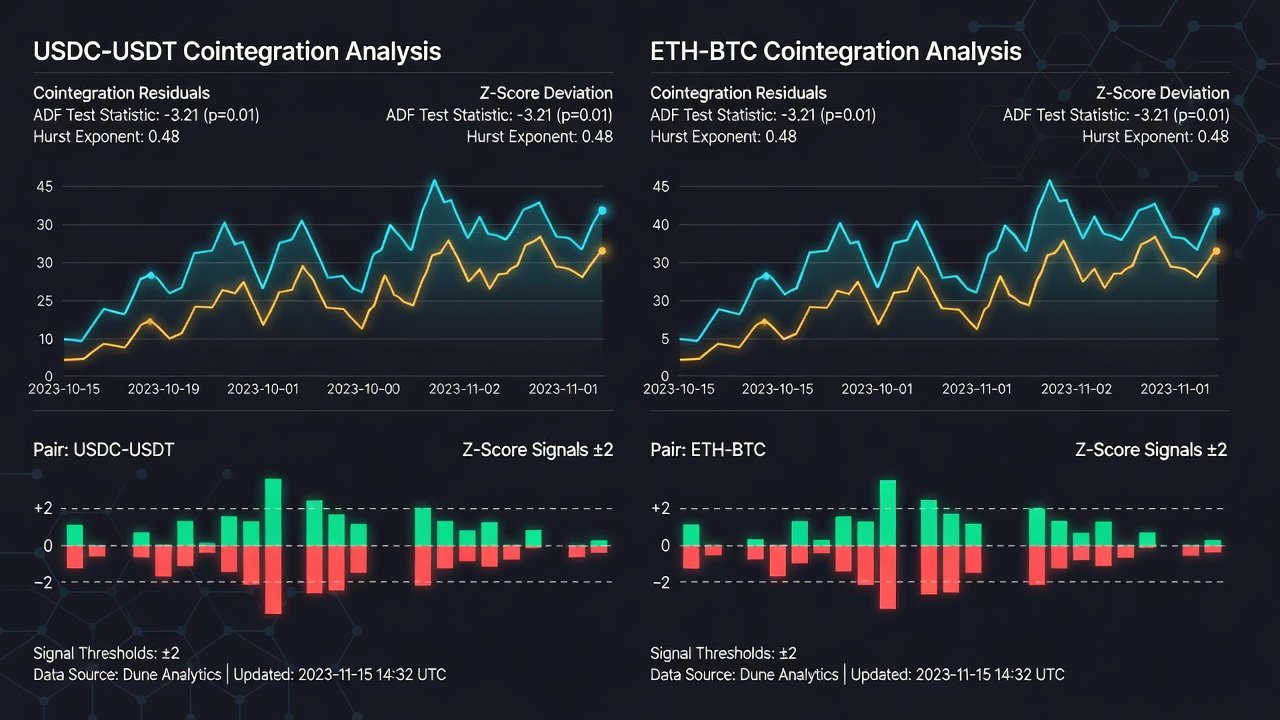
Effective pair trading begins with rigorous cointegration tests. The Augmented Dickey-Fuller test and Engle-Granger two-step method remain foundational. Traders apply these to price series from decentralized exchanges to confirm long-term equilibrium relationships. For example, testing USDC-USDT or ETH-BTC pairs reveals cointegration strength. Use Python libraries like statsmodels for on-chain data pulled via APIs. Additional methods include the Johansen test for multiple pairs and Phillips-Ouliaris for robustness against structural breaks. In practice, collect at least 90 days of hourly price data from DEXes such as Uniswap or Curve. Run rolling window tests every 24 hours to detect when cointegration weakens. Common pitfalls include overfitting to historical data without forward-testing on new market regimes. Always validate results across different timeframes and account for gas fees when simulating trades on testnets.
Sourcing Signals from Dune Analytics and Nansen
Dune Analytics provides customizable dashboards for on-chain metrics such as liquidity pool imbalances and trading volumes. Query historical pair data to spot mean reversion opportunities. Nansen delivers labeled wallet insights and smart money flows, highlighting when institutional activity signals potential pair divergences. Combine these sources for robust entry signals. Additional techniques involve tracking token transfer volumes between exchanges and monitoring oracle price feeds for discrepancies. Create custom Dune queries that flag when the spread between two assets exceeds historical norms by two standard deviations while on-chain volume remains elevated. Cross-reference Nansen smart money alerts to confirm whether large holders are accumulating one side of the pair. This multi-source approach reduces false positives from noisy on-chain data.
Building Entry and Exit Rules with Real Examples
Entry rules typically trigger when the spread z-score exceeds 2 standard deviations. For stablecoin pairs like USDC-DAI, exit at mean reversion or a 1.5 z-score threshold. Blue-chip examples include WETH-WBTC on Ethereum, where funding rate divergences add confirmation. Develop rules that incorporate multiple filters: require both statistical deviation and supporting on-chain evidence such as unusual swap activity in liquidity pools. For a stablecoin pair trade, enter long the undervalued stablecoin and short the overvalued one when the z-score hits +2.5, then scale out in tranches as the spread narrows. In blue-chip scenarios, add a funding rate overlay where negative funding on one asset strengthens the long leg. Document every trade with screenshots of the z-score chart and on-chain transaction hashes. Review weekly to refine thresholds based on recent volatility. Avoid entering during major events like protocol upgrades that can break historical relationships.
- Monitor 30-day rolling correlations and require values above 0.85 for pair selection.
- Incorporate on-chain volume filters above average to ensure liquidity.
- Set stop-losses at 3 standard deviations to limit drawdowns during breakdowns.
- Use limit orders on aggregators to minimize slippage in fast-moving markets.
Automation Setups via Keepers or Bots
Deploy keepers on networks like Ethereum or Arbitrum using Chainlink or custom Gelato tasks. Bots monitor cointegration scores in real time and execute trades via DEX aggregators when thresholds are met. Test on testnets before mainnet deployment. Build modular bots that separate signal generation from execution to allow easy updates. Integrate with The Graph for subgraph queries that pull live pair data. Schedule keeper jobs every 15 minutes during high-volatility periods and hourly otherwise. Include circuit breakers that pause trading if gas prices spike above normal levels or if correlation drops suddenly. Log all bot decisions to a dashboard for post-trade analysis. Start with small position sizes during the first month of live operation to validate the full pipeline.
Position Sizing Formulas and Risk Mitigation
Use the Kelly Criterion adapted for pairs: position size equals edge divided by odds. Account for correlation breakdowns by monitoring rolling betas and reducing exposure during high-volatility events. Diversify across chains to avoid single-network risks. Calculate position size as a percentage of total portfolio, capping any single pair at 8 percent. Implement dynamic sizing that shrinks positions when recent volatility exceeds the 30-day average. Maintain a separate risk budget for tail events such as depegs or oracle failures. Regularly rebalance the overall portfolio to keep pair exposures balanced. Review correlation matrices weekly and pause new entries if any pair shows signs of decoupling.
Performance Comparison Across Chains
Ethereum offers deep liquidity for blue-chip pairs but higher fees. Layer-2 solutions like Base provide faster execution with lower costs. Solana excels in stablecoin pairs due to speed, though with different slippage profiles. Compare metrics such as average time to fill, effective spread capture, and realized volatility across chains. Ethereum pairs often show stronger cointegration but suffer during congestion. Arbitrum and Optimism balance cost and liquidity well for most blue-chip trades. Solana offers advantages for high-frequency stablecoin arbitrage yet requires careful monitoring of network outages. Run parallel backtests on each chain using the same pair to identify the optimal venue for your capital size.
Integration with Funding Rate Plays
Pair mean reversion with perpetual funding rates for enhanced alpha. When a pair deviates and funding turns negative on one leg, the combined strategy captures both reversion and carry. Monitor rates via on-chain oracles for timely adjustments. Construct a hybrid signal that multiplies the z-score by the absolute funding rate differential. This weights entries more heavily when both statistical and carry opportunities align. Close positions early if funding flips against the trade. Track cumulative funding payments separately from price PnL to evaluate the strategy components independently.
Conclusion
DeFi pair trading in 2026 rewards disciplined application of on-chain analytics and risk controls. Start with paper trading cointegrated pairs before scaling to live capital.
FAQ
How does slippage affect pair trades?
Slippage widens spreads during low liquidity; mitigate with limit orders and smaller position sizes on volatile pairs. Always simulate fills using historical order book data before going live.
What causes data lag in on-chain signals?
Indexing delays in analytics platforms can lag by minutes; cross-reference multiple sources for accuracy and add a confirmation delay of one block before execution.
Are there regulatory considerations?
Traders must comply with local securities laws; decentralized protocols do not eliminate jurisdictional requirements for large volumes. Consult legal counsel when managing institutional capital.
What mistakes should beginners avoid?
Overfitting tests to past data, ignoring transaction costs, and failing to monitor live correlation changes are the most common errors. Maintain a trading journal to track and correct these issues.


No comments yet. Be the first!