 CryptoChain Blog

Introduction to Statistical Arbitrage in DeFi 2026
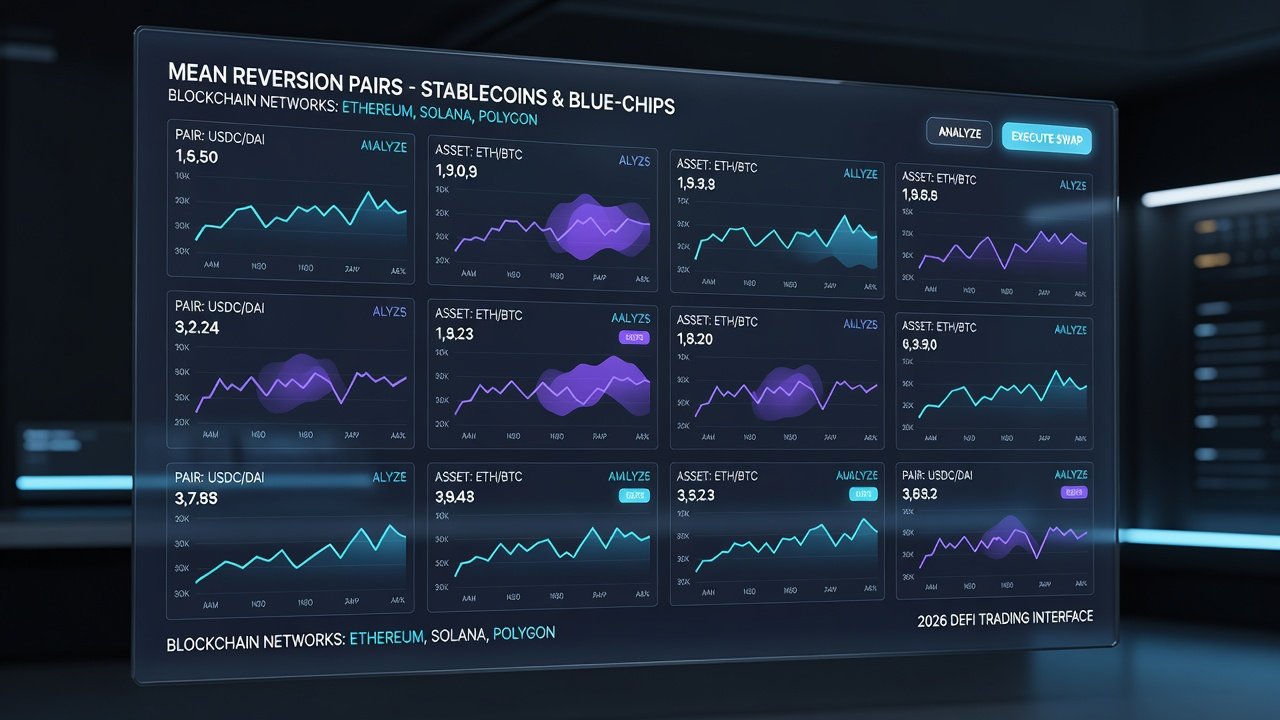
Statistical arbitrage, or stat arb, has evolved significantly in decentralized finance as traders seek data-driven edges beyond simple directional bets. In 2026, DeFi pair trading focuses on cointegrated asset pairs that exhibit mean-reverting behavior across decentralized exchanges and perpetual futures platforms. This approach allows sophisticated retail and institutional participants to capture alpha while managing risks in volatile crypto markets. The core idea rests on the principle that certain asset pairs maintain a long-term equilibrium relationship even when short-term deviations occur due to liquidity shocks, news events, or temporary sentiment shifts.
Successful implementation requires identifying pairs with strong statistical relationships, sourcing reliable on-chain data, defining precise entry and exit rules, and automating execution. This guide explores these elements in depth, drawing on practical examples and proven methodologies. Traders who master these tactics can build resilient strategies that perform across bull, bear, and sideways markets by focusing on relative value rather than absolute price direction.
Identifying Cointegrated Asset Pairs Across DEXes and Perps
Cointegration occurs when two assets move together over time despite short-term divergences. In DeFi, traders scan pairs like ETH/USDC on Uniswap versus perpetual contracts on platforms such as GMX or Hyperliquid. Tools for discovery include correlation matrices combined with Augmented Dickey-Fuller tests to confirm stationarity in spreads. Additional techniques involve Engle-Granger two-step methods or Johansen cointegration tests applied to historical price series pulled from multiple chains.
Popular pairs in 2026 often involve major assets such as BTC/ETH or stablecoin cross-pairs on multiple chains. Cross-DEX analysis reveals arbitrage opportunities when liquidity fragmentation creates temporary mispricings. Focus on high-liquidity venues to minimize execution friction. For instance, examining WETH/USDC pools on Uniswap V4 alongside equivalent perpetual markets on dYdX can highlight spreads that revert within hours or days. Always verify cointegration strength over multiple timeframes, including 30-day, 90-day, and 180-day windows, to avoid spurious relationships that break during regime changes.
Sourcing Mean-Reversion Signals Using Dune Analytics and Nansen
On-chain data platforms provide the foundation for signal generation. Dune Analytics enables custom queries for trading volume, liquidity pool imbalances, and historical spreads. Users can build dashboards tracking cointegration scores across Ethereum, Arbitrum, and Base. Advanced queries might aggregate swap data from multiple DEX routers to compute rolling z-scores on price spreads, incorporating filters for minimum liquidity thresholds and active trading hours.
Nansen adds labeled wallet intelligence and smart money flows, helping identify when institutional flows precede mean reversion. Combine these with Python-based statistical libraries to calculate z-scores for entry signals. Real-world application often involves exporting query results into Jupyter notebooks for further analysis, where traders can apply Kalman filters or Ornstein-Uhlenbeck processes to model the speed of mean reversion. This layered approach ensures signals are both statistically robust and grounded in actual blockchain activity. 
Setting Entry and Exit Rules
Entry rules typically trigger when the z-score of the spread exceeds 2 standard deviations from the mean, indicating overextension. Exit occurs at mean reversion or when the score returns to zero. Incorporate time-based stops to avoid prolonged drawdowns, such as closing positions after 72 hours if no reversion materializes. Practical examples include monitoring a BTC/ETH pair where a z-score of +2.5 prompts a short perpetual and long spot position, with profit taking at z-score 0.5 to capture most of the expected reversion.
Position sizing should account for volatility, often using Kelly Criterion adjusted for crypto-specific tail risks. Always define maximum exposure per pair to prevent over-concentration. Additional rules might include volume confirmation filters, requiring at least 20% above average daily volume before entry, and avoiding trades during major macroeconomic announcements that could disrupt correlations.
Automating Execution with Custom Bots
Custom bots built on frameworks like Python with Web3.py or Rust-based solvers connect directly to DEX routers and perp order books. These bots monitor live spreads, execute conditional orders, and handle gas optimization across chains. A typical bot architecture includes a data ingestion module pulling from WebSocket feeds, a signal engine running statistical calculations every 30 seconds, and an execution module that routes trades through aggregators while respecting slippage limits.
Integration with keepers or relayers ensures 24/7 operation. Test thoroughly on testnets before mainnet deployment to validate latency and slippage behavior. Advanced setups incorporate machine learning overlays to dynamically adjust parameters based on recent market regimes, improving adaptability without overfitting.
Risk Controls: Stop-Loss, Position Sizing, and Slippage Mitigation
Robust risk management separates sustainable strategies from those that fail. Implement hard stop-loss thresholds at 3-4 standard deviations or fixed percentage drawdowns. Dynamic position sizing based on recent volatility prevents oversized bets during turbulent periods. For example, reduce position size by 50% when the 7-day realized volatility exceeds the 30-day average.
Slippage mitigation involves routing through aggregators, splitting orders, and setting strict tolerance parameters. Monitor on-chain liquidity depth in real time to avoid adverse selection. Additional controls include circuit breakers that pause trading if total portfolio drawdown reaches 5% in a single day and diversification rules limiting exposure to any single pair below 15% of capital.
Real 2026 Case Studies and Protocol Comparisons
Case studies from early 2026 highlight successful ETH/USDC pairs on Uniswap V4 versus perp platforms, where mean reversion yielded consistent returns during range-bound markets. One documented example involved a 14-day trade on Arbitrum where the spread reverted after a liquidity event, generating positive expectancy after fees. Comparisons show GMX offering deeper perp liquidity while Uniswap provides better spot execution for smaller sizes. Other protocols like Aerodrome on Base and Jupiter on Solana present unique pair opportunities with varying fee structures and oracle reliability. Uniswap documentation often serves as a reference for understanding pool mechanics that influence pair behavior across these ecosystems.
Backtesting Methods for DeFi Stat Arb
Backtesting demands historical on-chain data replay with realistic slippage and fee modeling. Use libraries such as Backtrader or VectorBT to simulate multi-year periods across different market regimes. Validate out-of-sample performance and account for regime shifts like regulatory changes or liquidity events. Incorporate walk-forward optimization and Monte Carlo simulations to assess robustness under varied fee and slippage assumptions.
Key metrics to track include Sharpe ratio, maximum drawdown, win rate, and average holding period. Always include transaction cost modeling based on current gas prices and protocol fees to ensure backtests reflect live trading conditions accurately.
Common Pitfalls for Retail Traders
- Overfitting models to historical data without forward testing.
- Ignoring smart contract risks and oracle failures that can invalidate cointegration assumptions.
- Neglecting cross-chain bridging costs and delays that erode small edges.
- Underestimating competition from sophisticated bots that front-run signals.
- Failing to diversify across multiple uncorrelated pairs, leading to concentrated risk.
- Overlooking regulatory shifts that affect DEX liquidity or perpetual trading availability.
- Using insufficient data granularity, such as ignoring intraday liquidity fluctuations.
Avoid these by maintaining strict documentation, using conservative assumptions, and continuously monitoring live performance metrics. Regular audits of bot code and data sources further reduce operational risks.
Conclusion
DeFi pair trading through statistical arbitrage offers a structured path to data-driven alpha in 2026. By mastering cointegration analysis, on-chain intelligence from platforms like Dune and Nansen, disciplined rules, and automated risk-managed execution, traders can navigate complex markets effectively. Continuous learning and adaptation remain essential as DeFi infrastructure matures, with ongoing refinements to models ensuring strategies stay competitive amid evolving liquidity landscapes and technological advancements.

No comments yet. Be the first!