 CryptoChain Blog

Introduction to Statistical Arbitrage in DeFi
Statistical arbitrage, or stat arb, has evolved into a sophisticated quantitative approach for DeFi traders in 2026. Unlike simple yield farming, on-chain pair trading exploits temporary price divergences between correlated assets using cointegration analysis and mean-reversion signals. This guide delivers practical tactics for advanced users seeking data-driven edges across DEXes. The growth of decentralized liquidity has created abundant opportunities as protocols fragment across multiple chains, leading to frequent but short-lived mispricings that quantitative strategies can capture systematically.
Traders monitor assets like ETH and stETH or USDC and DAI pairs where historical relationships break temporarily. By identifying cointegrated pairs and executing mean-reverting trades, participants capture spreads while managing on-chain risks such as slippage and smart contract vulnerabilities. In 2026 the ecosystem includes deeper liquidity on Layer-2 networks, enabling higher frequency strategies than were feasible in prior years.
Understanding Cointegration Testing for Crypto Pairs
Cointegration testing forms the foundation of reliable pair trading. Two assets are cointegrated when their price spread remains stationary over time despite individual non-stationarity. In practice, traders apply the Augmented Dickey-Fuller test or Engle-Granger two-step method on on-chain price data. Additional techniques such as the Johansen test allow for multi-asset cointegration when expanding beyond simple two-asset pairs.
Popular tools include Python libraries like statsmodels integrated with blockchain indexers. For example, fetching historical prices from Uniswap V3 pools allows calculation of the hedge ratio via ordinary least squares regression. Only pairs passing the test at 95% confidence proceed to signal generation. Traders frequently examine rolling windows of 30 to 90 days to account for changing market regimes, ensuring the relationship has not broken down permanently.
Sourcing Mean-Reversion Signals from Dune Analytics and Nansen
Dune Analytics provides community dashboards tracking real-time DEX volumes, liquidity depths, and price spreads. Custom queries on Ethereum and Layer-2 pools reveal when spreads deviate beyond two standard deviations from the mean. Users can fork existing dashboards that aggregate pool data from multiple protocols and add filters for minimum liquidity thresholds.
Nansen offers labeled wallet flows and smart money alerts that complement statistical signals. Combining on-chain labels with cointegration z-scores helps filter noise from genuine regime shifts. Traders often export these datasets into custom Python scripts for automated monitoring. Additional sources such as Flipside Crypto dashboards can cross-validate signals before execution.
Entry and Exit Rules for On-Chain Pair Trades
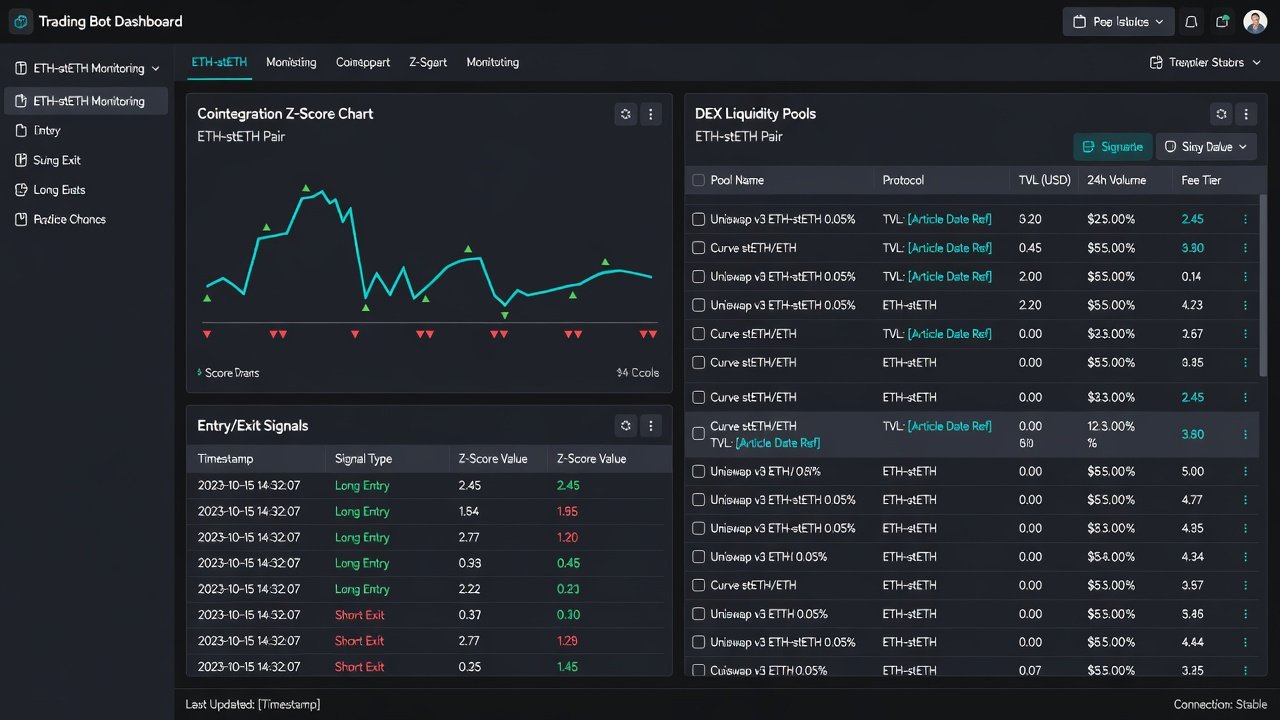
Standard entry triggers when the z-score of the spread exceeds 2.0 in absolute value. Long the underperformer and short the outperformer in equal notional value adjusted by the hedge ratio. Exit occurs at mean reversion (z-score near zero) or at a stop-loss of 3.0 standard deviations. Some strategies incorporate Bollinger Bands on the spread series to add visual confirmation of extreme deviations.
Position sizing accounts for current liquidity. On Uniswap or Curve, traders split orders across multiple blocks to minimize slippage. Time-based exits after 48 hours prevent holding through structural breaks. Advanced rules may include volume-weighted average price filters to ensure entries occur during periods of sufficient market depth.
Real Protocol Examples Across Major DEXes
Examples include trading the ETH-stETH pair on Curve Finance where liquid staking derivatives exhibit strong cointegration. Another case involves stablecoin pairs like USDT-USDC on Uniswap V3 concentrated liquidity positions. Balancer weighted pools also support multi-asset stat arb when correlations hold. On Arbitrum, traders have successfully paired GMX perpetual tokens against spot equivalents during funding rate dislocations.
Execution requires flash loans from Aave or Maker to achieve delta-neutral entries without large capital outlays. These protocols enable atomic arbitrage while returning borrowed funds within the same transaction. PancakeSwap pairs on BNB Chain offer additional opportunities for cross-chain stat arb when bridged assets temporarily decouple from their Ethereum counterparts.
Risk Controls: Slippage, Liquidation, and Smart Contract Exposure
Slippage mitigation involves setting tight price impact tolerances below 0.3% and routing through aggregators like 1inch. Liquidation risk arises in leveraged positions; always maintain collateral ratios above protocol minimums by 150%. Monitoring oracle latency is critical because delayed price feeds can trigger false signals during network congestion.
Additional controls include circuit breakers that pause bots during extreme volatility detected via Chainlink oracles. Regular audits of custom contracts and use of established proxies reduce smart contract risk. Diversifying across three to five uncorrelated pairs limits single-pair blowups, while maintaining a maximum portfolio allocation of 15% per strategy prevents overexposure.
Manual vs Automated Execution Comparison
- Manual trading offers full control and intuition but suffers from latency and emotional bias during fast-moving markets.
- Automated bots deliver 24/7 execution with precise z-score thresholds yet require robust infrastructure and continuous monitoring for API failures.
- Hybrid approaches let traders review signals daily while bots handle entries and exits, combining human oversight with machine speed.
- Backtesting shows automated systems capture 30-40% more opportunities than manual methods on the same pair universe.
Automation typically outperforms manual methods by capturing fleeting opportunities that last only minutes on-chain. However, manual intervention remains valuable when major protocol upgrades or governance votes threaten cointegration assumptions.
Step-by-Step Bot Setup Walkthrough
- Connect a Dune or Nansen API key to a Python environment and validate data freshness every 15 minutes.
- Implement cointegration tests on selected pairs using 30-day rolling windows and store results in a local database.
- Build a signal engine that publishes alerts via Telegram or Discord webhooks when z-scores breach thresholds.
- Integrate with Web3.py for transaction signing on target DEXes, including gas estimation and priority fee calculations.
- Deploy on a VPS with redundancy and add kill switches for emergency halts triggered by abnormal spread behavior.
- Backtest against historical on-chain data before live deployment and run paper trading for at least two weeks.
- Implement logging of every trade decision with reasons for entry and exit to facilitate post-trade analysis.
Backtesting and Strategy Optimization
Robust backtesting requires tick-level data from multiple DEXes to simulate realistic slippage. Optimization involves tuning the lookback period for cointegration tests and the z-score entry threshold. Walk-forward analysis prevents overfitting by testing parameters on out-of-sample periods. Common metrics include Sharpe ratio, maximum drawdown, and win rate adjusted for trading fees.
FAQ: Addressing Common Pitfalls
How do traders handle data lag in on-chain feeds?
Use indexed sources like The Graph or direct RPC calls with low-latency nodes. Cross-verify prices across multiple DEXes to detect stale data before acting on signals.
What happens during regime shifts?
Monitor rolling cointegration p-values daily. If a pair fails the test for more than three consecutive days, pause trading and reselect pairs from a refreshed universe.
Are transaction fees prohibitive?
Focus on high-liquidity pairs on low-cost chains such as Arbitrum or Base. Batch multiple signals into single transactions where possible to reduce cumulative costs.
How should traders respond to sudden liquidity drains?
Implement real-time liquidity checks before order submission and maintain a whitelist of acceptable pool depths to avoid executing in thin markets.
Conclusion
DeFi statistical arbitrage in 2026 rewards traders who combine rigorous cointegration analysis with reliable data sources and disciplined risk management. By following the outlined tactics and automating execution thoughtfully, advanced users can move beyond basic strategies into consistent quantitative performance while adapting to evolving on-chain conditions.


No comments yet. Be the first!