 CryptoChain Blog
Introduction to Statistical Arbitrage in DeFi
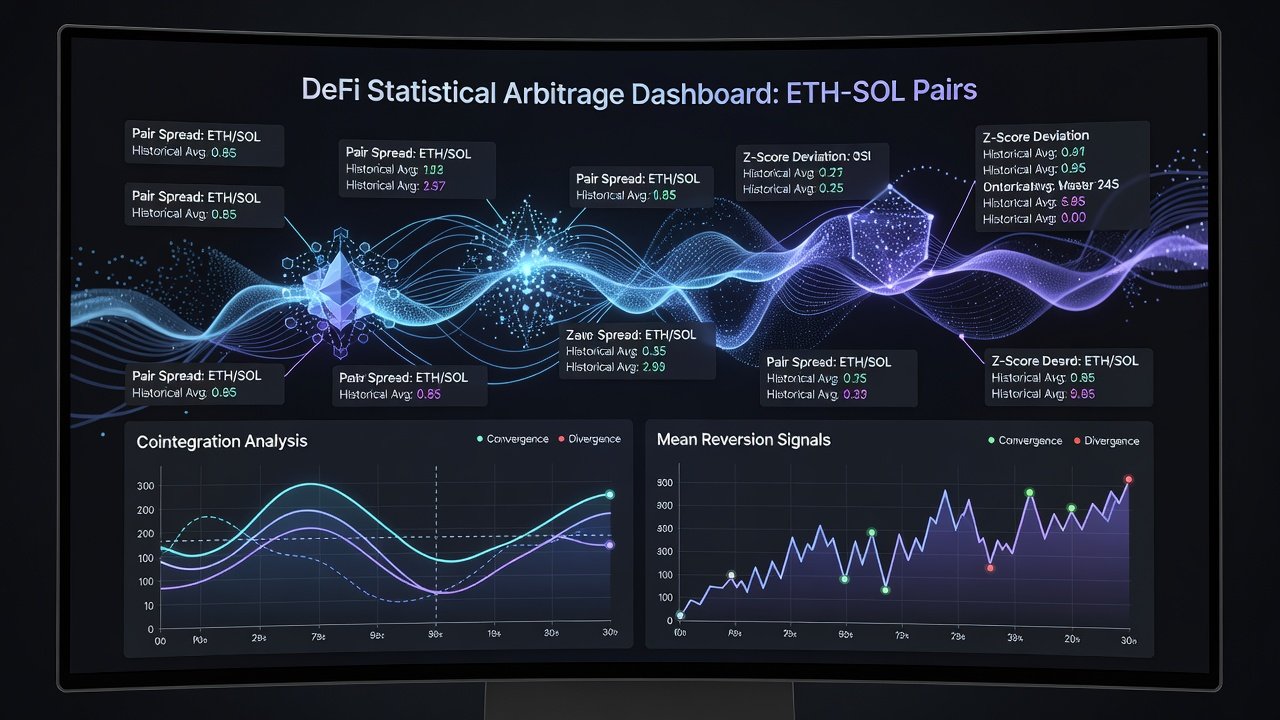
Statistical arbitrage in decentralized finance leverages quantitative models to identify temporary price inefficiencies between correlated crypto assets. In 2026, data-driven pair trading tactics have become essential for traders seeking consistent returns across volatile DeFi protocols. This approach relies on cointegration tests and mean reversion signals rather than directional bets, allowing participants to profit from relative price movements regardless of broader market trends. The strategy has gained traction as DeFi ecosystems mature, with liquidity fragmented across multiple chains and protocols creating frequent but fleeting opportunities for informed traders.
By combining on-chain analytics with automated execution, traders can capitalize on opportunities in liquidity pools, lending markets, and derivatives platforms. The rise of multi-chain ecosystems has expanded the scope for these strategies, making real-time data sources indispensable. Unlike traditional arbitrage that exploits absolute price differences, statistical methods focus on probabilistic edges derived from historical relationships, offering a more robust framework in the unpredictable world of decentralized markets.
Core Metrics: Cointegration and Mean Reversion Signals
Cointegration measures the long-term relationship between two asset prices, confirming they move together despite short-term deviations. Traders apply the Augmented Dickey-Fuller test or Johansen test to validate pairs. Mean reversion signals then trigger entries when the spread deviates beyond historical thresholds, expecting convergence. Understanding these metrics requires familiarity with time-series analysis concepts adapted to blockchain data feeds.
Key indicators include the z-score of the price spread, half-life of mean reversion, and rolling correlation windows. Monitoring these metrics helps filter noise from genuine opportunities in DeFi token pairs such as stablecoin derivatives or wrapped asset variants. For example, a pair like stETH and ETH might show strong cointegration on Ethereum, with deviations often corrected within hours during normal market conditions. Traders calculate the half-life to estimate how quickly the spread reverts, informing optimal holding periods and avoiding premature exits.
Additional layers involve residual analysis from regression models and stationarity checks on the spread series. In practice, pairs with half-lives under 48 hours tend to suit high-frequency approaches, while longer ones favor swing-style execution. These quantitative foundations reduce emotional decision-making and provide clear, rule-based entry and exit criteria.
Leveraging Real-Time Data from Dune Analytics and Nansen
Accessing accurate on-chain data is critical for 2026 pair trading. Dune Analytics provides customizable dashboards tracking DEX volumes, liquidity depth, and cross-protocol flows. Nansen offers wallet labeling and behavioral insights that reveal smart money movements influencing pair spreads. Integrating both platforms creates a comprehensive view of market microstructure that off-chain tools cannot match.
Combining these platforms allows identification of arbitrage windows before they close. For instance, monitoring Ethereum-based stablecoin pools alongside Solana equivalents reveals cross-chain divergences driven by network congestion or yield shifts. Advanced users query raw event logs to build custom alerts for unusual volume spikes or liquidity migrations that signal potential pair breakdowns or new opportunities.
Step-by-Step Setup for Custom Trading Bots
Building bots starts with selecting a framework like Python with Web3.py for Ethereum or Anchor for Solana. Connect to RPC endpoints, fetch historical price data, and implement cointegration models using libraries such as statsmodels. The process demands careful attention to data quality and latency minimization across chains.
- Define target pairs and backtest parameters over 6-12 months of on-chain data, ensuring inclusion of both bull and bear regimes.
- Code entry/exit logic based on z-score thresholds and position sizing rules, incorporating filters for minimum liquidity and maximum spread volatility.
- Integrate oracles for real-time pricing and simulate slippage using historical order book snapshots from multiple DEX aggregators.
- Deploy on secure infrastructure with monitoring via Telegram alerts or custom dashboards, adding fallback mechanisms for RPC failures.
- Implement logging for every trade decision to facilitate post-trade analysis and model refinement.
Multi-chain examples include pairing ETH-USDC on Uniswap with SOL-USDC on Raydium, adjusting for bridge fees and latency differences. Bots must handle chain-specific nuances such as account abstraction on Ethereum and program-derived addresses on Solana.
Risk Controls: Position Sizing and Slippage Management
Effective risk management prevents catastrophic drawdowns. Use volatility-adjusted position sizing where exposure scales with recent spread volatility. Limit individual trades to 1-2% of portfolio capital and enforce maximum drawdown stops at the strategy level. Diversification across uncorrelated pairs further reduces tail risks.
Slippage is mitigated through limit orders, dynamic gas fee estimation, and splitting large positions across multiple blocks or venues. Always simulate execution costs in backtests to avoid over-optimistic results. Additional safeguards include circuit breakers that pause trading during extreme volatility events detected via on-chain oracle anomalies.
Backtesting Workflows and Performance Evaluation
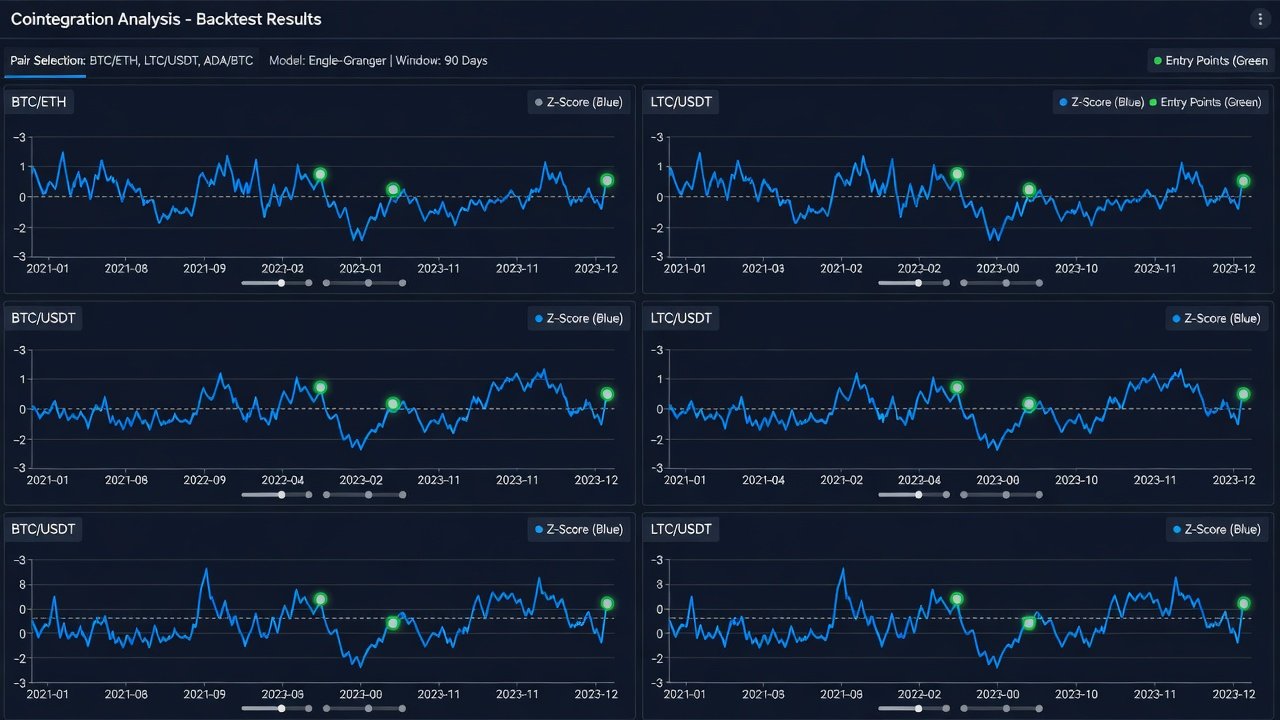
Robust backtesting requires walk-forward optimization and out-of-sample testing to account for regime changes in DeFi markets. Incorporate transaction costs, funding rates, and impermanent loss when evaluating pair strategies. Compare Sharpe ratios and maximum drawdowns against buy-and-hold benchmarks to validate edge persistence.
Tools like Jupyter notebooks integrated with The Graph subgraphs streamline this process for both Ethereum and Solana environments. Performance metrics should include not only returns but also trade frequency, average holding time, and win rate distribution. Regular re-optimization prevents model decay as market dynamics evolve.
Manual vs Automated Execution Comparison
Manual execution offers flexibility for nuanced market interpretation but suffers from latency and emotional bias. Automated systems excel in speed and consistency, executing hundreds of micro-trades daily based on predefined rules. The choice depends on available capital, technical expertise, and time commitment.
- Manual: Better for low-frequency, high-conviction pairs; requires constant screen time and deep protocol knowledge to interpret external catalysts.
- Automated: Ideal for high-frequency statistical arbitrage; demands rigorous monitoring of bot health, API reliability, and periodic code audits.
- Hybrid: Combines both by using automation for signal generation while retaining human oversight for position adjustments during major protocol upgrades or black swan events.
Many successful practitioners start manual to understand market nuances before transitioning to full automation.
Practical Multi-Chain Examples in 2026
Consider a live example involving bridged USDT across Ethereum and Solana. When the spread widens beyond two standard deviations due to temporary bridge congestion, the bot shorts the expensive leg and longs the cheaper one. Execution involves simultaneous swaps on Curve and Jupiter, with careful monitoring of finality times on each chain. Another case pairs liquid staking derivatives like cbETH and stETH, where yield differentials create mean-reverting opportunities captured through automated rebalancing.
FAQs on Regulatory Considerations and Common Pitfalls
What regulatory factors affect DeFi statistical arbitrage?
Traders must monitor evolving frameworks from bodies like the SEC and international AML guidelines. KYC requirements on centralized on-ramps and tax reporting of realized gains remain key considerations even in decentralized environments. Compliance with travel rule implementations across jurisdictions is increasingly relevant for cross-border flows.
What are common pitfalls in pair trading?
Overfitting models to historical data, ignoring regime shifts from protocol upgrades, and underestimating liquidity risks during stress periods top the list. Always validate cointegration stability across multiple market cycles and maintain conservative assumptions about execution quality.
How do I start safely in 2026?
Begin with paper trading on testnets, gradually scale live positions while maintaining strict risk parameters. Continuous education through community forums and updated documentation from protocol teams is essential for staying ahead of changes.
In conclusion, data-driven pair trading tactics empower DeFi participants to navigate 2026 markets with precision. By mastering cointegration, leveraging analytics platforms, and implementing disciplined automation, traders can build resilient strategies that thrive amid volatility while managing downside exposure effectively.


No comments yet. Be the first!